
A common challenge for investors is finding companies that combine firm basic business momentum with a positive technical setup. One method to spot such opportunities is by looking for stocks that display solid fundamental growth, firm financial condition, and earnings, while also showing a technical chart formation that indicates a possible breakout. This method tries to match a company's good operational path with a time of market notice, where the price movement starts to show the basic strength. The stock found through this process is TRADEWEB MARKETS INC-CLASS A (NASDAQ:TW).
A Firm Fundamental Base
For a stock to be seen as a solid growth choice, it must show steady and better expansion in its main financial measures. According to the fundamental analysis report for Tradeweb, the company grades well on many important points that are vital for a growth-focused plan.
- Notable Growth Path: Tradeweb's growth grade of 7 out of 10 is supported by a strong recent record. Over the last year, the company has seen a 22.17% rise in revenue and a 20.00% increase in earnings per share (EPS). More notably, its average yearly EPS growth over recent years is 23.66%, a speed that greatly exceeds many others in the field.
- High Earnings and Financial Condition: Solid growth is most lasting when joined with high earnings and a strong balance sheet. Tradeweb does well here, with an earnings grade of 7 and a financial condition grade of 8. The company has a firm profit margin of 31.45% and an operating margin of 40.10%, putting it in the high group of its field. Importantly, Tradeweb works with no debt, and its current and quick ratios of 3.71 show enough cash to pay for operations and future growth plans.
- Price Context: The main point of care in the basic view is price. With a Price/Earnings (P/E) ratio of 31.63, the stock is not low-cost and sells at a higher price than many in the capital markets area. However, this is partly reasonable given the company's high-quality earnings picture and firm expected future EPS growth of 14.55%. For growth investors, paying a higher price for better and steady results can be a measured risk.
A Technical Formation Indicating Possible Movement
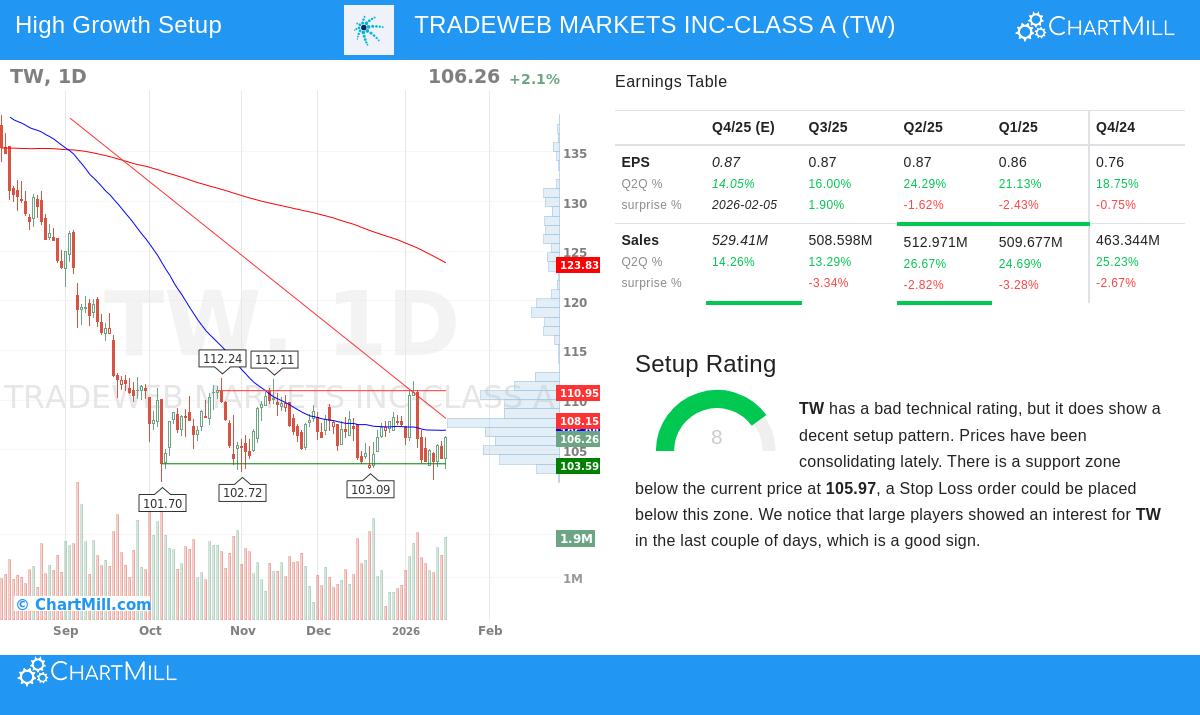
While basics describe the company's motor, technical study looks at the market's feeling and price activity. The technical analysis report for TW shows a detailed picture, but one with a positive formation grade of 8 out of 10, which is the main filter used in the looking method.
- Base Building Near a Floor: After a large drop from its 52-week highs, TW's price has been forming a base in a band between about $102 and $112 over the past month. It is now trading near the bottom of this band, close to a set floor area between $103.46 and $105.97. This area is strengthened by several moving averages and trend lines, adding to its importance.
- The Breakout Idea: The looking method especially searches for technical breakout shapes. The thought is that a stock forming a base after a down path, while making a foundation of support, may be getting ready for a move up if buying force comes back. A clear move above the recent base resistance, particularly the area around $110.72 to $110.95, could mark the start of such a turn, mainly if joined by high volume.
- Different Market Paths: It is important to see that TW's overall technical grade is low (2 out of 10), with both its short and long-term paths labeled as bad. This shows that the chance is speculative and based on a possible turn from a low level. The positive formation grade points out the pattern development, but it needs proof through price action.
Why the Pairing is Important
The looking system is strong because it links two key parts. Solid fundamental growth, earnings, and condition (as seen in TW's high grades in these areas) give the cause for a stock to gain value over time. They show the company is taking market part, making money well, and is financially safe. However, picking an entry time can be hard.
This is where the technical formation becomes key. A pattern of base building near a floor, after a drop, can spot a point where selling force may be ending and the stock is finding a new balance. For a basically sound company, this can show a possible turning point where market feeling starts to match the business facts. The method states that when a high-growth, financially fit stock starts to show this kind of technical base activity, the risk/reward view for a possible upward move may get better.
Locating Like Chances
Tradeweb Markets shows an example of a company with excellent growth and financial measures that is now testing an important technical floor level. Investors curious about searching for other stocks that fit this specific mix of solid basics and positive technical patterns can use the set screen.
You can find more results from this "Solid Growth Stocks with good Technical Formation Grades" screen by clicking here.
Disclaimer: This article is for information only and is not financial advice, a suggestion, or a deal to buy or sell any securities. The information shown on TRADEWEB MARKETS INC-CLASS A (TW) is based on data and reports present at the time of writing and may not be full or current. Investing in stocks includes risk, including the possible loss of original funds. You should do your own full study and think about talking with a qualified financial advisor before making any investment choices. Past results of a security or looking system are not a guide for future results.