
Exploring Growth Potential: TRADEWEB MARKETS INC-CLASS A (NASDAQ:TW) and Its Base Formation. Growth investors seek promising revenue and EPS growth, and TRADEWEB MARKETS INC-CLASS A has come under our scrutiny for potential growth investing. While it's crucial to do your own research, we've detected TRADEWEB MARKETS INC-CLASS A on our screen for growth with base formation, suggesting it merits a closer look.
Looking at the Growth
ChartMill assigns a proprietary Growth Rating to each stock. The score is computed by evaluating various growth aspects, like EPS and revenue growth. We take into account the history as well as the estimated future numbers. TW was assigned a score of 8 for growth:
- The Earnings Per Share has grown by an impressive 29.78% over the past year.
- TW shows a strong growth in Earnings Per Share. Measured over the last years, the EPS has been growing by 23.66% yearly.
- TW shows a strong growth in Revenue. In the last year, the Revenue has grown by 28.98%.
- The Revenue has been growing by 17.35% on average over the past years. This is quite good.
- Based on estimates for the next years, TW will show a quite strong growth in Earnings Per Share. The EPS will grow by 15.79% on average per year.
- Based on estimates for the next years, TW will show a quite strong growth in Revenue. The Revenue will grow by 10.69% on average per year.
Assessing Health for TW
Every stock is evaluated by ChartMill, receiving a Health Rating on a scale of 0 to 10. This assessment considers different health aspects, including liquidity and solvency, both in absolute terms and relative to industry peers. TW has achieved a 8 out of 10:
- An Altman-Z score of 12.61 indicates that TW is not in any danger for bankruptcy at the moment.
- TW's Altman-Z score of 12.61 is amongst the best of the industry. TW outperforms 96.04% of its industry peers.
- TW has no outstanding debt. Therefor its Debt/Equity and Debt/FCF ratios are 0 and belong to the best of the industry.
- TW has a Current Ratio of 3.99. This indicates that TW is financially healthy and has no problem in meeting its short term obligations.
- TW's Current ratio of 3.99 is amongst the best of the industry. TW outperforms 84.58% of its industry peers.
- A Quick Ratio of 3.99 indicates that TW has no problem at all paying its short term obligations.
- TW's Quick ratio of 3.99 is amongst the best of the industry. TW outperforms 84.58% of its industry peers.
Profitability Examination for TW
Discover ChartMill's exclusive Profitability Rating, a proprietary metric that assesses stocks on a scale of 0 to 10. It takes into consideration various profitability ratios and margins, both in absolute terms and relative to industry peers. Notably, TW has achieved a 7:
- Looking at the Return On Assets, with a value of 6.89%, TW belongs to the top of the industry, outperforming 82.82% of the companies in the same industry.
- Looking at the Return On Invested Capital, with a value of 7.58%, TW belongs to the top of the industry, outperforming 80.62% of the companies in the same industry.
- The 3 year average ROIC (6.25%) for TW is below the current ROIC(7.58%), indicating increased profibility in the last year.
- TW's Profit Margin of 29.03% is fine compared to the rest of the industry. TW outperforms 69.16% of its industry peers.
- TW's Profit Margin has improved in the last couple of years.
- TW's Operating Margin of 39.55% is fine compared to the rest of the industry. TW outperforms 69.60% of its industry peers.
- TW's Operating Margin has improved in the last couple of years.
Looking at the Setup
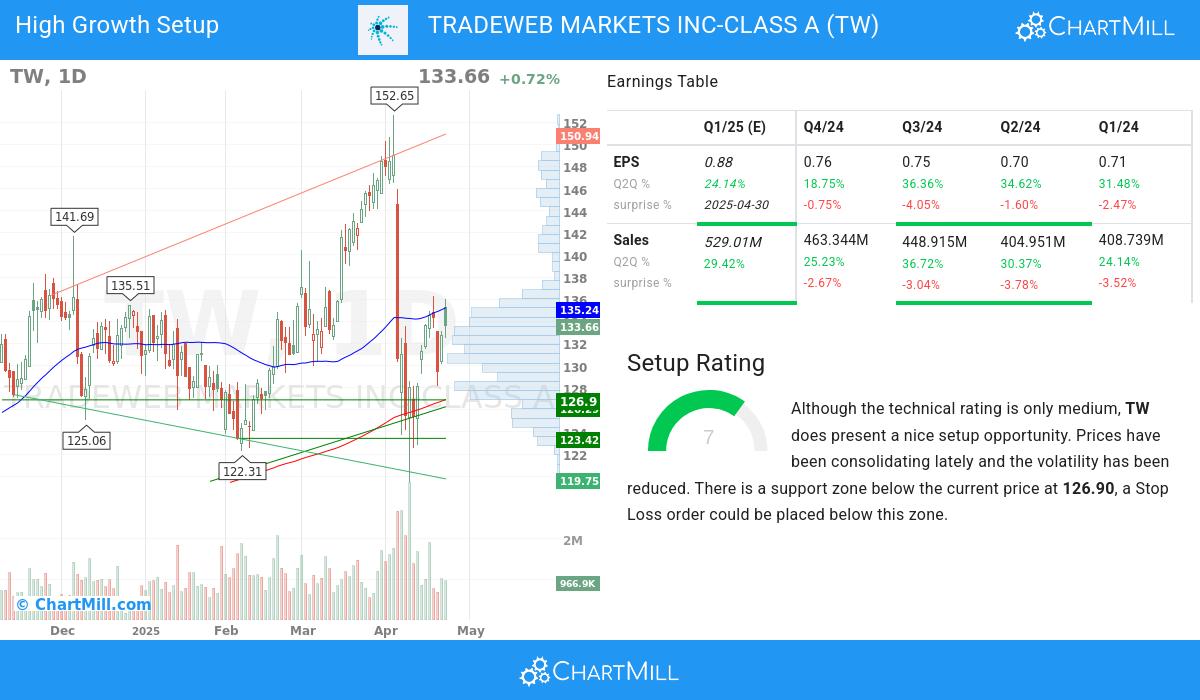
ChartMill assigns a Setup Rating to every stock to determine the degree of consolidation. This rating, ranging from 0 to 10, is updated daily and evaluates various short-term technical indicators. TW currently holds a 7 as its setup rating, suggesting a particular level of consolidation in the stock.
TW has only a medium technical rating, but it does show a decent setup pattern. We see reduced volatility while prices have been consolidating in the most recent period. There is a support zone below the current price at 126.90, a Stop Loss order could be placed below this zone.
Our Strong Growth screener lists more Strong Growth stocks and is updated daily.
For an up to date full fundamental analysis you can check the fundamental report of TW
For an up to date full technical analysis you can check the technical report of TW
Keep in mind
Important Note: The content of this article is not intended as trading advice. It is essential to perform your own analysis and exercise caution when making trading decisions. The article presents observations created by automated analysis but does not guarantee any trading or investment outcomes. Always trade responsibly and make independent judgments.