
For investors looking to join strict technical rules with fundamental growth trends, the method made popular by Mark Minervini gives an organized system. This process, frequently called the SEPA (Specific Entry Point Analysis) strategy, depends on finding stocks that are both in strong, confirmed uptrends and supported by improving business results. The aim is to find market leaders early in their large price gains by using two filters: the technical "Trend Template" to check price strength and momentum, and fundamental checks to confirm the basic earnings and sales growth. This pairing tries to seize stocks with the chance for large moves while controlling risk through exact entry and exit rules.
TTM TECHNOLOGIES INC (NASDAQ:TTMI) has recently appeared on a scan made to find such chances, fitting both the strict technical rules of the Minervini Trend Template and meeting the standards for high growth momentum investing. The printed circuit board manufacturer’s recent price movement and financial numbers indicate it may be matching the situations that often come before notable outperformance.
A Clear Technical Trend
At its heart, the Minervini Trend Template is made to remove all but the strongest stocks, making sure an investor only looks at equities with definite, layered momentum. TTMI now meets these important technical points, which are required in the SEPA process:
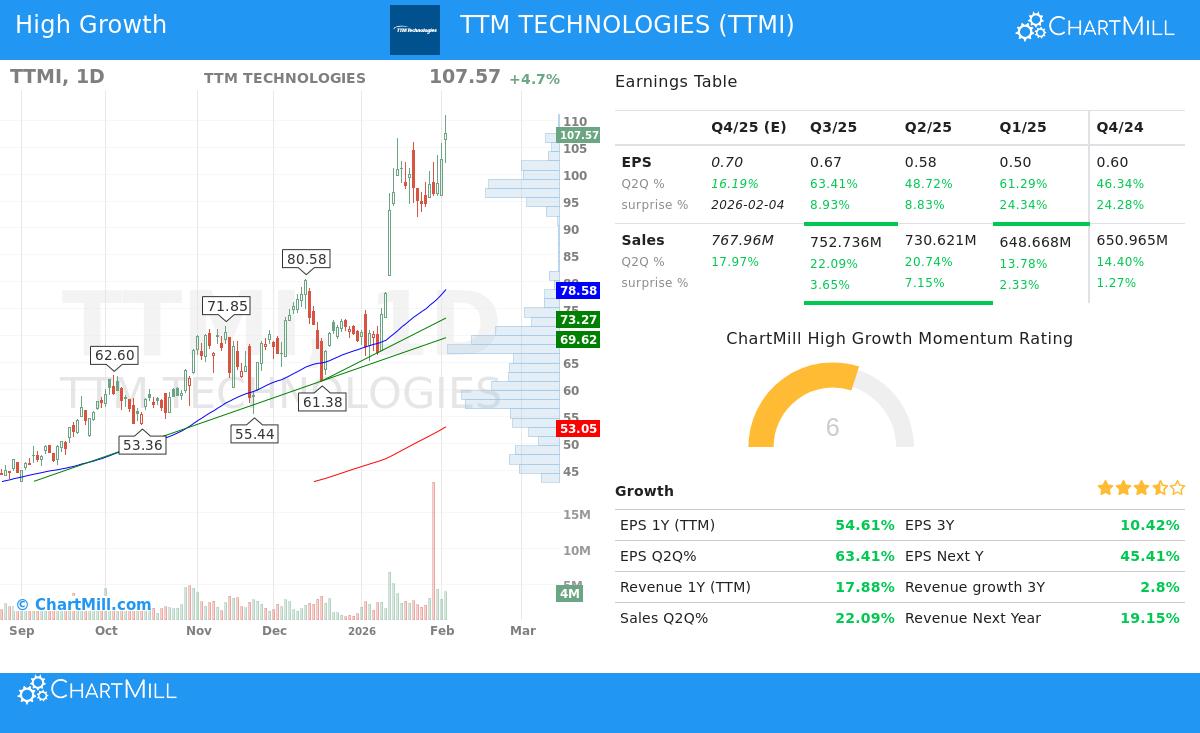
- Moving Average Alignment: The stock's price is trading well above its rising 50-day, 150-day, and 200-day simple moving averages (SMAs). Importantly, the shorter-term averages are ordered above the longer-term ones (50-day > 150-day > 200-day), confirming an organized uptrend across several timeframes.
- Proximity to Highs: A main rule of the strategy is to focus on strength, not low price. TTMI's current price is within 3% of its 52-week high of $111.00, showing it is a market leader, not a follower. At the same time, the price is about 580% above its 52-week low, pointing to a strong recovery and continued uptrend.
- Superior Relative Strength: The stock has a ChartMill Relative Strength (CRS) ranking of 98.87, meaning it has done better than nearly 99% of the whole market over the past year. Minervini notes that the largest winners usually show high relative strength early in their moves, as it points to institutional buying and leadership.
This technical view shows a stock in a definite "Stage 2" advance, the exact phase where the Minervini strategy aims to take part.
The Fundamental Basis for Growth
A strong chart by itself is insufficient. The strategy requires that technical strength be checked by getting better business fundamentals, which give the reason for continued price gains. TTMI shows several signs that match high-growth momentum investing:
- Earnings Acceleration: The company is displaying a pattern of getting faster earnings growth on a quarterly basis. Year-over-year EPS growth has jumped from 46.3% three quarters ago to 63.4% in the latest quarter. This step-by-step improvement is a good sign that business momentum is increasing.
- Consistent Earnings Surprises: TTMI has exceeded analyst EPS estimates in each of the last four quarters, with an average surprise of over 16%. Steady outperformance often leads to higher changes in future estimates, which can drive more buying.
- Strong Sales Growth: Revenue growth stays solid, with the last quarter showing a 22.1% year-over-year increase. This top-line growth gives a firm base for bottom-line growth.
- Getting Better Profitability: Maybe most significantly, the company's profit margin has grown notably in recent quarters, rising from 0.79% to 7.05% over the past year. This shows not just revenue growth, but better operational efficiency and pricing ability, a sign of a fundamentally improving business.
These parts join to form what Minervini calls the "fundamental" and "catalyst" pieces of the SEPA checklist, suggesting the price trend is backed by real business progress.
Technical Condition and Setup Points
According to ChartMill's own analysis, TTMI is given a perfect Technical Rating of 10 out of 10, reflecting outstanding condition across trend, momentum, and relative strength measures. The report states the stock is in positive trends on both a short and long-term basis and is trading with high volume on its upward moves, confirming institutional interest.
However, the analysis also gives a note of warning for traders waiting for a particular entry point. The stock's Setup Quality Rating is now a 3, showing that after its strong recent rise, the price movement has been unstable and it is not now forming a tight, low-risk pause pattern like a Volatility Contraction Pattern (VCP). For strict followers of the Minervini method, this indicates the stock is better kept on a watchlist for the present, waiting for a possible future pause that would give a more clear, lower-risk entry point as per the SEPA rules. You can see the full technical details in the ChartMill Technical Report for TTMI.
Conclusion
TTM Technologies shows a strong example of a stock that matches the ideas of growth momentum investing inside a set technical system. It clearly meets the Minervini Trend Template, showing the kind of strong, leadership-level trend the strategy needs. Fundamentally, it backs this technical view with getting faster earnings, consistent beats, and growing margins.
For investors, TTMI shows the kind of candidate that strict scanning can find: a company in a solid uptrend with fundamental momentum. While the present stretched price movement may suggest waiting for a new tactical entry, the mix of factors makes it a stock deserving of close watching for signs of its next pause and possible next leg higher.
Interested in finding more stocks that fit this high-growth, trending profile? You can run the same scan using the High Growth Momentum + Trend Template screener on ChartMill.
,
Disclaimer: This article is for informational and educational purposes only. It is not intended as investment advice, nor does it constitute a recommendation to buy, sell, or hold any security. The analysis is based on data provided and certain methodologies, past performance is not indicative of future results. Always conduct your own due diligence and consider consulting with a qualified financial advisor before making any investment decisions.