
For investors looking to join strict technical rules with fundamental growth trends, the method created by Mark Minervini offers a strong framework. This system, called the SEPA (Specific Entry Point Analysis) method, sorts the market for stocks showing both strong price movements and improving business results. The aim is to find market leaders early in their major price increases by using a fixed checklist: the Trend Template for technical condition and a group of fundamental checks for earnings and sales trends. Stocks that meet these requirements are not just going up; they are frequently the top performers in the most solid industries, supported by better financial numbers that draw investment from large funds.
TTM Technologies (NASDAQ:TTMI) appears as a present example that fits this two-part plan. As a maker of printed circuit boards and backplane assemblies, the company works in important aerospace, defense, and high-end commercial areas. A recent filter made to find stocks satisfying Minervini's Trend Template while also having a High Growth Momentum (HGM) score has singled out TTMI for more review.
Checking the Trend Template Fit
Minervini's Trend Template is a basic technical filter that confirms a stock is in a clear, strong uptrend across different time periods. It works as a checkpoint, removing weak or correcting charts to concentrate only on those with proven strength. TTMI's present technical picture shows a good match with these main points:
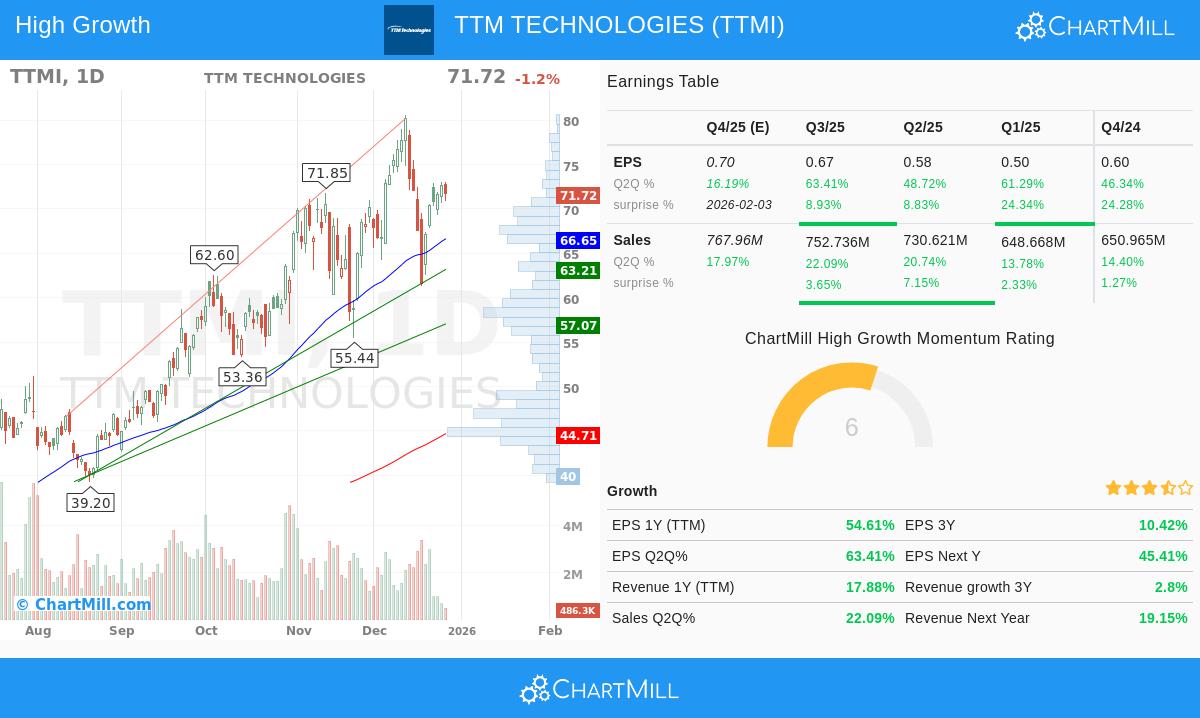
- Price Above Key Moving Averages: The stock price ($71.72) trades clearly above its rising 50-day ($66.65), 150-day ($52.07), and 200-day ($44.71) simple moving averages (SMAs). This order is a main rule of the template, confirming the stock is in a clear Stage 2 uptrend.
- Moving Average Order: The 50-day SMA is above the 150-day SMA, which is above the 200-day SMA. This "ordered" setup shows steady buying interest and a speeding uptrend.
- Nearness to Highs: A main Minervini idea is to focus on strength, not low price. TTMI's price is now within 11% of its 52-week high of $80.58, meeting the template's rule to be within 25% of the high. At the same time, the price is a large 355% above its 52-week low, showing a strong recovery trend.
- Better Relative Strength: Maybe most important, TTMI has a ChartMill Relative Strength (CRS) score of 97.63. This means it has done better than nearly 98% of all stocks over the past year. High relative strength is a sign of market leadership and a required filter in the Minervini system, as the strongest stocks early in a cycle often keep leading.
Reviewing the High Growth Momentum Fundamentals
While the Trend Template finds the "how" of a stock's move, the "why" often exists in its fundamental trend. The High Growth Momentum part of the filter looks for companies showing speeding financial performance, a trait that usually supports continued price gains. TTMI's recent financial numbers show several good points:
- Earnings Speed Increase: The company is showing solid and speeding earnings per share (EPS) growth on a quarterly basis. Comparing the newest quarter to the year-ago period shows growth of 63.4%. The earlier quarters showed growth of 48.7%, 61.3%, and 46.3%, pointing to a strong and steady rise in profit.
- Steady Earnings Surprises: TTMI has topped analyst EPS estimates in each of the last four quarters, with an average surprise over 16%. This habit of beating forecasts can push positive estimate changes and new investor attention.
- Getting Better Profit Margins: The fundamental view is made stronger by a clear trend of growing profitability. The profit margin has improved in order over the last four reported quarters, going from 0.79% to 7.05%. This hints at not just sales growth, but also better operational efficiency and pricing ability.
- Good Revenue Growth: Revenue growth stays healthy, with the last quarter up 22.1% year-over-year. Analyst opinion is also positive, with next-year EPS estimates changed upward by 5.66% over the last three months.
Technical Condition and Setup Points
According to ChartMill's own analysis, TTMI gets a top-level Technical Rating of 10 out of 10, showing very good health across short and long-term trends. The report states the stock is doing better than 97% of the market and 96% of its industry group. Both the short-term and long-term trends are scored as positive, matching well with the wider market's present direction.
However, the analysis also gives a note of care for immediate buying. The Setup Quality rating is a medium 4, meaning that while the stock's trend is very good, its recent price action has been a bit unsteady. The report proposes waiting for a time of sideways movement to form a clearer, lower-risk buying point. This shows a main part of the Minervini plan: finding a strong example is only the first step; buying at a clear, low-risk turning point is key for handling risk.
A Beginning Place for More Study
For investors wanting to find similar examples that mix technical trend strength with fundamental growth momentum, the filtering process that found TTMI can be a useful beginning place. You can look at the present market for other possible ideas using the High Growth Momentum + Trend Template filter on ChartMill.
To conclude, TTM Technologies (TTMI) shows an example of a stock that meets the strict technical filters of the Minervini Trend Template, trading in a strong uptrend with leading relative strength. This technical strength is backed by a fundamental picture showing speeding earnings, growing margins, and positive analyst estimate changes. While the ChartMill technical report suggests waiting for a better buying setup, the combination of these factors makes TTMI a strong example for growth-focused investors to watch carefully. For a full look at the stock's support levels, volume trends, and full technical analysis, see the complete ChartMill Technical Report for TTMI.
Disclaimer: This article is for informational and educational purposes only. It is not a recommendation to buy or sell any security. The analysis is based on current data and a specific investment methodology. All investing involves risk, including the potential loss of principal. You should conduct your own research and consult with a qualified financial advisor before making any investment decisions.