
TORO CO (NYSE:TTC) has caught the attention of dividend investors as a stock worth considering. TTC excels in profitability, solvency, and liquidity, all while providing a decent dividend. Let's delve into the details.
Understanding TTC's Dividend Score
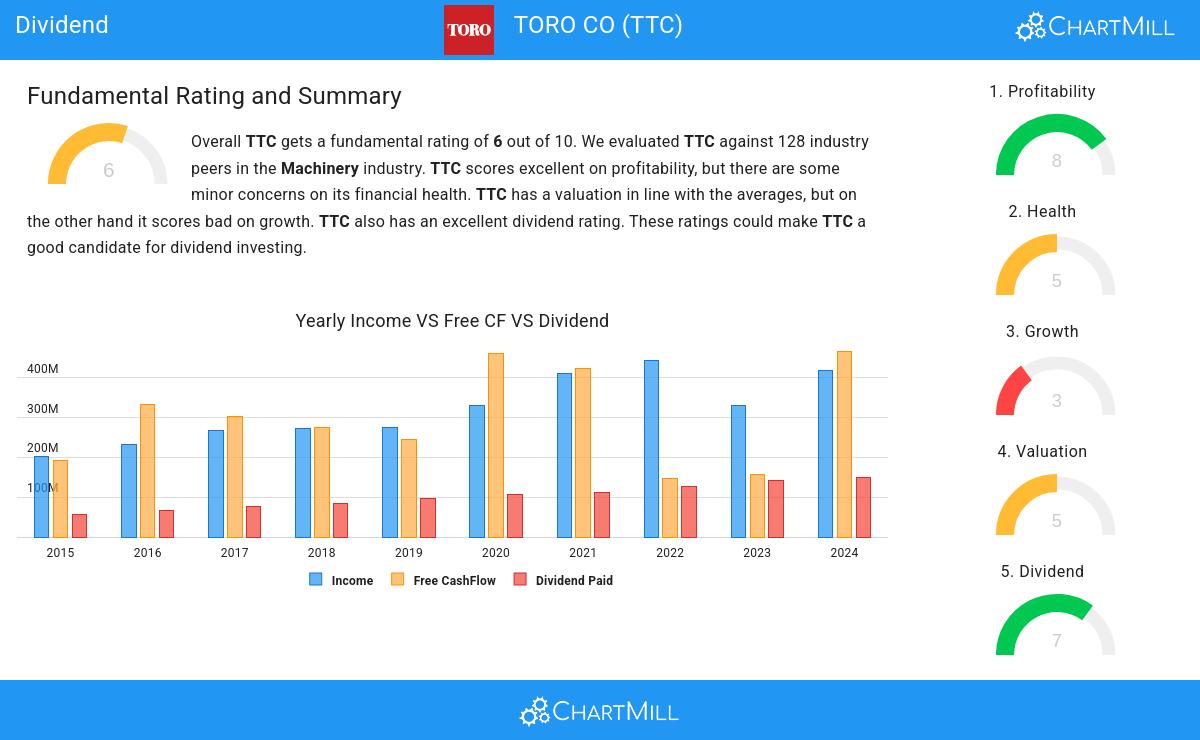
To gauge a stock's dividend quality, ChartMill utilizes a Dividend Rating ranging from 0 to 10. This comprehensive assessment considers various dividend aspects, including yield, history, growth, and sustainability. TTC has achieved a 7 out of 10:
- Compared to an average industry Dividend Yield of 1.82, TTC pays a better dividend. On top of this TTC pays more dividend than 84.38% of the companies listed in the same industry.
- On average, the dividend of TTC grows each year by 9.97%, which is quite nice.
- TTC has been paying a dividend for at least 10 years, so it has a reliable track record.
- TTC has not decreased their dividend for at least 10 years, which is a reliable track record.
- 36.97% of the earnings are spent on dividend by TTC. This is a low number and sustainable payout ratio.
What does the Health looks like for TTC
ChartMill employs a unique Health Rating system for all stocks. This rating, ranging from 0 to 10, is determined by analyzing various liquidity and solvency ratios. For TTC, the assigned 5 for health provides valuable insights:
- TTC has an Altman-Z score of 4.52. This indicates that TTC is financially healthy and has little risk of bankruptcy at the moment.
- TTC has a Altman-Z score of 4.52. This is in the better half of the industry: TTC outperforms 71.09% of its industry peers.
- TTC has a debt to FCF ratio of 2.17. This is a good value and a sign of high solvency as TTC would need 2.17 years to pay back of all of its debts.
- TTC has a better Debt to FCF ratio (2.17) than 76.56% of its industry peers.
- Although TTC does not score too well on debt/equity it has very limited outstanding debt, which is well covered by the FCF. We will not put too much weight on the debt/equity number as it may be because of low equity, which could be a consequence of a share buyback program for instance. This needs to be investigated.
What does the Profitability looks like for TTC
ChartMill assigns a proprietary Profitability Rating to each stock. The score is computed by evaluating various profitability ratios and margins and ranges from 0 to 10. TTC was assigned a score of 8 for profitability:
- TTC's Return On Assets of 11.00% is amongst the best of the industry. TTC outperforms 82.03% of its industry peers.
- TTC has a better Return On Equity (27.72%) than 92.19% of its industry peers.
- TTC has a Return On Invested Capital of 15.85%. This is amongst the best in the industry. TTC outperforms 89.06% of its industry peers.
- The Average Return On Invested Capital over the past 3 years for TTC is significantly above the industry average of 10.79%.
- TTC has a Profit Margin of 8.89%. This is in the better half of the industry: TTC outperforms 66.41% of its industry peers.
- The Operating Margin of TTC (11.42%) is better than 60.16% of its industry peers.
- In the last couple of years the Operating Margin of TTC has grown nicely.
Every day, new Best Dividend stocks can be found on ChartMill in our Best Dividend screener.
For an up to date full fundamental analysis you can check the fundamental report of TTC
Keep in mind
Important Note: The content of this article is not intended as trading advice. It is essential to perform your own analysis and exercise caution when making trading decisions. The article presents observations created by automated analysis but does not guarantee any trading or investment outcomes. Always trade responsibly and make independent judgments.