
For investors looking to join strict technical rules with growth analysis of business fundamentals, the method made popular by Mark Minervini gives a planned system. This system, often called the SEPA (Specific Entry Point Analysis) strategy, depends on finding stocks that are already in strong upward moves, confirmed by a particular group of moving average positions and price levels, while also showing quickening earnings and sales growth. The aim is to locate market leaders early in their main price climbs, where the meeting of technical force and fundamental speed makes a high-likelihood situation for large profits. A stock that satisfies both the technical "Trend Template" and displays the signs of high-growth fundamentals becomes a top choice for more study.
TAIWAN SEMICONDUCTOR-SP ADR (NYSE:TSM) appears as a stock that deserves more examination through this two-part method. As the top dedicated semiconductor foundry globally, its position is closely linked to worldwide technology needs, from artificial intelligence to consumer electronics. Recent results indicate it may fit with the standards looked for by growth-oriented, trend-aligned plans.
Checking the Trend Template Fit
The Minervini Trend Template is made to sort for stocks in a clear, lasting upward move, staying away from unclear or poor price patterns. It applies a strict order of moving averages and price behavior to make sure only the most forceful choices are reviewed. A look at TSM's present technical state shows it hits these important marks:
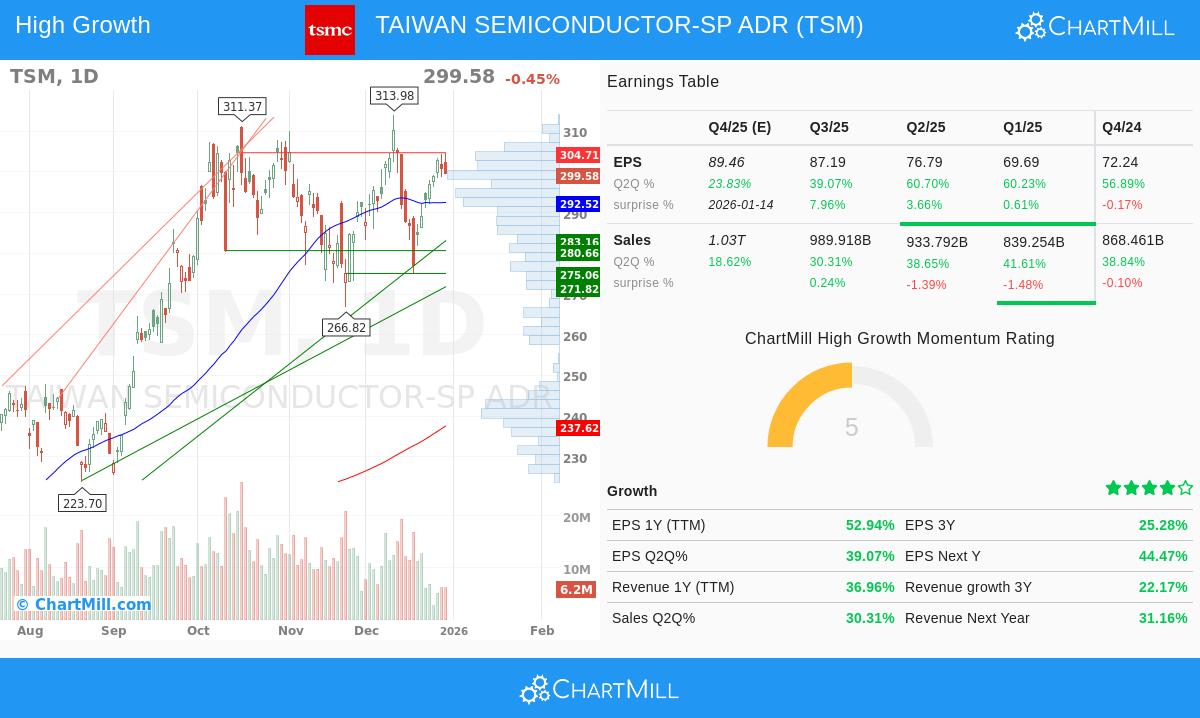
- Price Above Important Averages: The stock is trading notably above its rising 50-day ($292.52), 150-day ($259.73), and 200-day ($237.62) simple moving averages (SMAs). This meets the main need of trading in a long-term bull market stage.
- Moving Average Position: The 50-day SMA is located above both the 150-day and 200-day SMAs, and the 150-day SMA is above the 200-day SMA. This ordered, upward-sloping position shows steady buying interest across several time periods, a sign of large investor buying.
- Nearness to Highs: TSM's present price is about 123% above its 52-week low of $134.25, showing a forceful recovery move. Significantly, it is trading within 5% of its 52-week high ($313.98), fitting the template's concentration on force, stocks close to new highs often show the strongest speed.
- Better Relative Strength: With a ChartMill Relative Strength (CRS) score of 87.28, TSM is doing better than almost 90% of the wider market. Minervini notes that real market leaders usually have RS scores above 70, and ideally in the 80s or 90s, meaning they are wanted even with general market changes.
This technical picture puts TSM solidly in what stage study would call a "Stage 2" climb, the main period where the largest gains normally happen. The good long-term and short-term moves mentioned in the technical report give more support to this sound upward move.
Checking High-Growth Fundamentals
While the Trend Template deals with the "when" to study a stock, the "why" is found in fundamental quickening. The High Growth Momentum (HGM) score tries to find companies with solid and getting better financial results, a central idea of the SEPA strategy which states that "big earnings draw big notice." TSM's recent financial numbers show the type of speed that draws large investors:
- Earnings Quickening: The company has reported back-to-back quarters of forceful year-over-year EPS growth, with the latest quarter up 39.1%, before quarters showing growth of 60.7% and 60.2%. This series of high, continued growth is a main good sign.
- Revenue Speed: Top-line growth stays solid, with recent quarterly sales growing between 30.3% and 41.6% year-over-year. This means strong need for its advanced manufacturing skills is changing straight into financial results.
- Analyst Belief: Forward guesses are increasing, a key point in Minervini's study. The average EPS guess for the next fiscal year has been changed upward by 8.0% over the past three months, hinting at growing analyst belief in the company's profit path.
- Profit Margin Growth: The company has shown a skill to change revenue growth into profits well. The profit margin in the last reported quarter was 45.7%, showing a gain over the 42.7% margin from the earlier quarter, meaning possible operating leverage and pricing strength.
These fundamental traits, quickening earnings on solid sales growth, joined with rising guesses, are exactly what the HGM score and the fundamental part of the SEPA strategy try to find. They give the catalytic "story" behind the technical price force.
Technical Condition and Situation Summary
The given technical study report gives TSM a solid technical score of 8 out of 10, noting its stable results and good moves across time periods. The situation quality score of 7 hints the stock is settling within its upward move, which can give a clearer zone for setting risk. The report finds a close resistance area around $302.85 - $304.71, with support located near $298.38. For traders using a breakout method, a move above this resistance on volume could be seen as a possible entry sign, with the support area working as a sensible zone for first stop-loss setting. You can study the full, detailed technical review for TSM here.
A Choice for the Growth and Speed Watchlist
In short, TAIWAN SEMICONDUCTOR-SP ADR shows a case where a forceful technical move, as described by the Minervini Trend Template, is backed by basic fundamental speed in earnings and sales growth. This fit makes it a related stock for investors filtering for high-growth speed inside a trend-aligned plan. It shows the strategy's central rule of looking for market leaders that are forceful both on the chart and in their financial results.
Interested in locating like possible situations? The filter that found TSM joins Minervini's trend standards with a search for high-growth fundamentals. You can study the present results and change the settings to your own standards through this link: High Growth Momentum + Trend Template Screen.
Disclaimer: This article is for information and learning only. It is not a suggestion to buy or sell any security. The study is based on present data and a particular investment method. All investing has risk, including the possible loss of original money. Always do your own study and think about your financial position and risk comfort before making any investment choices.