
For investors looking to find possible trading chances, technical analysis offers a way to examine stocks using price activity and chart formations. One organized method uses special scores to sort for stocks showing both good technical condition and positive entry arrangements. This process centers on two main measures: the Technical Rating, which reviews a stock's general trend health and speed, and the Setup Quality Rating, which examines how settled a stock's price activity has been, possibly signaling a coming price jump. By merging these scores, traders can find stocks that are both in clear upward trends and look ready for their next important price rise.
Technical Strength Review
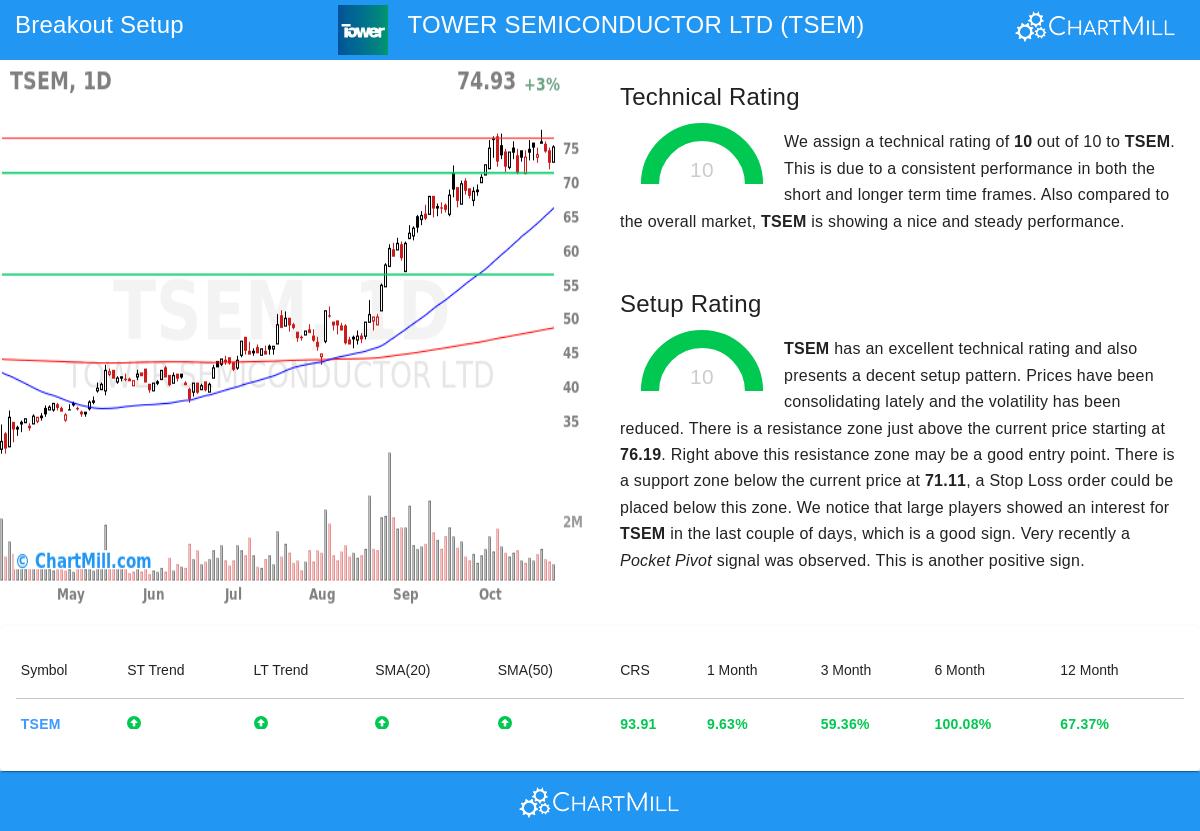
Tower Semiconductor Ltd (NASDAQ:TSEM) shows very good technical features based on the ChartMill review method. The company gets a full Technical Rating of 10, putting it with the market's best performers from a trend viewpoint. This top score shows wide health in many technical areas that are key for finding stocks with lasting upward speed.
Important technical positives backing this score are:
- Both extended and near-term trends are clearly good
- The stock is changing hands close to its 52-week top of $77.41
- Good comparative health, doing better than 93% of all stocks in the last year
- Group front-runner in Semiconductors & Semiconductor Equipment, doing better than 81% of similar companies
- Steady changing of hands above all main average lines (20-day, 50-day, 100-day, and 200-day)
The technical rating method focuses on lasting results across many time views, and Tower Semiconductor's steady place above important average lines while keeping good comparative health against both the wider market and its group mates confirms its full score. This wide technical health gives the base for viewing the stock as a possibility for extension of its set upward trend.
Setup Quality Review
Besides its strong technical base, Tower Semiconductor shows a similarly interesting setup shape with a full Setup Quality Rating of 10. This signals the stock has been changing hands in a settled band with lower price swings, possibly setting up for its next important price change. The setup quality measure is especially significant because it helps find times when a stock's price activity has become narrow, possibly giving clearer entry and exit spots for traders.
Notable setup features are:
- Recent changing hands band from $67.74 to $77.41 in the last month
- Present price place in the middle of this band
- Set support area from $71.11 to $71.11 made by several trend lines
- Resistance area seen at $76.19
- Recent big buyer attention found through volume study
- Recent Pocket Pivot signal showing stock gathering
The settling shape, mixed with the set support and resistance points, makes a plan for possible trade handling. The setup quality rating specially checks how "narrow" a stock's changing hands band has become, and Tower Semiconductor's present shape indicates the stock could be getting set for its next directed change after this time of settling.
Trade Plan Points
For technical traders watching Tower Semiconductor, the present chart shape shows clear points for possible trade planning. The meeting of technical health and setup quality makes situations that some breakout traders may find attractive for possible position start.
The automatic study indicates:
- Possible entry above resistance at $76.20
- Possible stop loss below support at $71.10
- Possible loss of about 6.69% on the trade
- Position size of about 14.94% of money for 1% account possible loss
It is important to see that the present price of $74.93 places the stock between the seen support and resistance areas, with lower price swings possibly coming before the next important price change. The mix of full technical and setup scores, plus recent big buyer attention and pocket pivot signals, makes this an interesting chart for technical traders to watch.
For investors looking for similar technical breakout chances, new setups are found each day using the Technical Breakout Setups screen, which methodically looks for stocks showing both good technical scores and high-grade setup shapes.
Disclaimer: This article shows technical study and is for information only. It is not investment guidance, and readers should do their own study and talk with a money advisor before making any investment choices. Trading has possible loss, including full loss of invested money.