
Unearth the potential of TENARIS SA-ADR (NYSE:TS) as a dividend stock recommended by our stock screening tool. TS maintains a robust financial footing and delivers a sustainable dividend. We'll delve into the details below.
A Closer Look at Dividend for TS
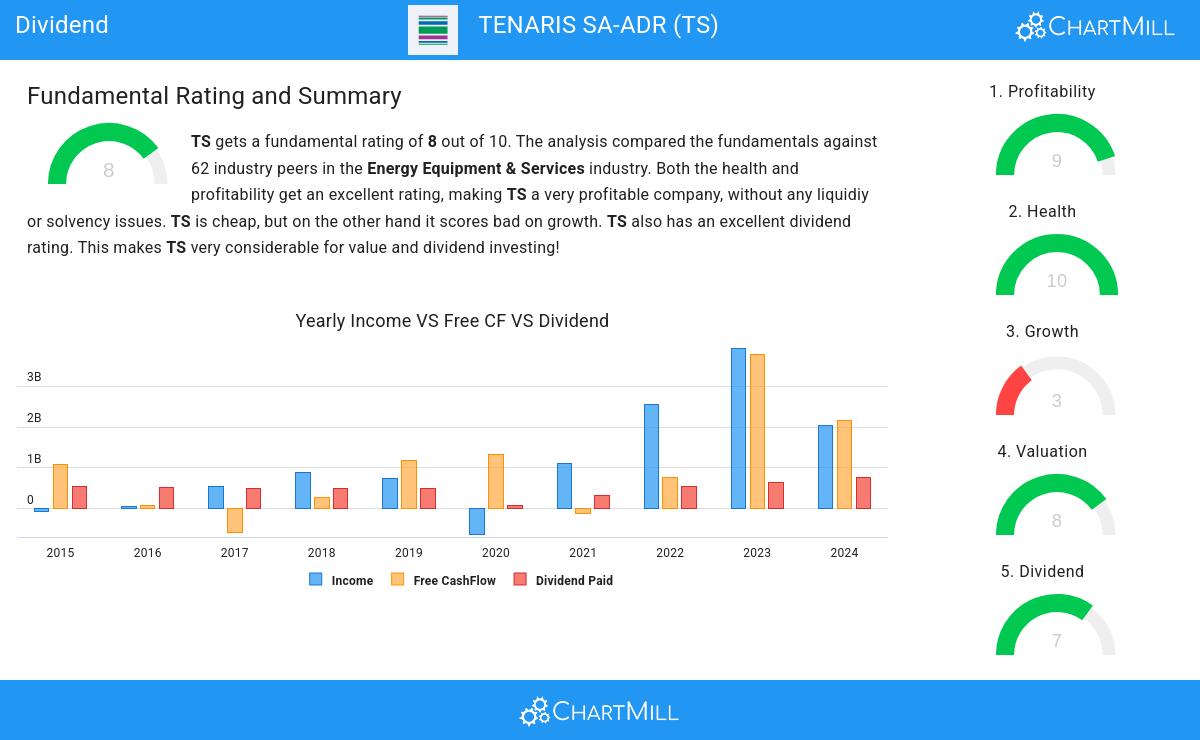
ChartMill assigns a proprietary Dividend Rating to each stock. The score is computed by evaluating various valuation aspects, like the yield, the history, the dividend growth and sustainability. TS was assigned a score of 7 for dividend:
- Compared to an average industry Dividend Yield of 3.99, TS pays a better dividend. On top of this TS pays more dividend than 87.10% of the companies listed in the same industry.
- Compared to an average S&P500 Dividend Yield of 2.44, TS pays a better dividend.
- The dividend of TS is nicely growing with an annual growth rate of 10.42%!
- TS has paid a dividend for at least 10 years, which is a reliable track record.
- TS pays out 37.21% of its income as dividend. This is a sustainable payout ratio.
Evaluating Health: TS
A critical element of ChartMill's stock evaluation is the Health Rating, which spans from 0 to 10. This rating considers multiple health factors, including liquidity and solvency, both in absolute terms and relative to industry peers. TS has received a 10 out of 10:
- TS has an Altman-Z score of 5.15. This indicates that TS is financially healthy and has little risk of bankruptcy at the moment.
- Looking at the Altman-Z score, with a value of 5.15, TS belongs to the top of the industry, outperforming 100.00% of the companies in the same industry.
- TS has a debt to FCF ratio of 0.27. This is a very positive value and a sign of high solvency as it would only need 0.27 years to pay back of all of its debts.
- TS's Debt to FCF ratio of 0.27 is amongst the best of the industry. TS outperforms 93.55% of its industry peers.
- TS has a Debt/Equity ratio of 0.01. This is a healthy value indicating a solid balance between debt and equity.
- TS has a Debt to Equity ratio of 0.01. This is amongst the best in the industry. TS outperforms 95.16% of its industry peers.
- TS has a Current Ratio of 3.50. This indicates that TS is financially healthy and has no problem in meeting its short term obligations.
- TS has a Current ratio of 3.50. This is amongst the best in the industry. TS outperforms 87.10% of its industry peers.
- TS has a Quick Ratio of 2.10. This indicates that TS is financially healthy and has no problem in meeting its short term obligations.
- TS's Quick ratio of 2.10 is fine compared to the rest of the industry. TS outperforms 79.03% of its industry peers.
Profitability Assessment of TS
Discover ChartMill's exclusive Profitability Rating, a proprietary metric that assesses stocks on a scale of 0 to 10. It takes into consideration various profitability ratios and margins, both in absolute terms and relative to industry peers. Notably, TS has achieved a 9:
- Looking at the Return On Assets, with a value of 9.96%, TS belongs to the top of the industry, outperforming 83.87% of the companies in the same industry.
- TS has a Return On Equity of 12.27%. This is in the better half of the industry: TS outperforms 64.52% of its industry peers.
- TS's Return On Invested Capital of 11.07% is fine compared to the rest of the industry. TS outperforms 79.03% of its industry peers.
- Measured over the past 3 years, the Average Return On Invested Capital for TS is significantly above the industry average of 8.16%.
- The 3 year average ROIC (16.25%) for TS is well above the current ROIC(11.07%). The reason for the recent decline needs to be investigated.
- TS's Profit Margin of 16.26% is amongst the best of the industry. TS outperforms 90.32% of its industry peers.
- In the last couple of years the Profit Margin of TS has grown nicely.
- TS has a Operating Margin of 18.90%. This is amongst the best in the industry. TS outperforms 82.26% of its industry peers.
- TS's Operating Margin has improved in the last couple of years.
- TS's Gross Margin of 35.04% is fine compared to the rest of the industry. TS outperforms 69.35% of its industry peers.
- In the last couple of years the Gross Margin of TS has grown nicely.
More Best Dividend stocks can be found in our Best Dividend screener.
For an up to date full fundamental analysis you can check the fundamental report of TS
Keep in mind
This is not investing advice! The article highlights some of the observations at the time of writing, but you should always make your own analysis and invest based on your own insights.