
For investors using technical analysis to find possible opportunities, a common plan looks for stocks that are both technically sound and ready to move out of a period of sideways trading. This method aims to mix momentum with a good potential for gain relative to risk. One way to find these stocks is by using filters that look for a high ChartMill Technical Rating, which measures a stock's general technical condition, and a high ChartMill Setup Quality Rating, which judges the state of its current price formation. A stock on this list implies it has the necessary condition for further progress and is forming a pattern that might come before a new upward move.
T. Rowe Price Group Inc (NASDAQ:TROW) was recently identified as a candidate from this kind of technical screen. The asset manager's stock displays a picture that technical investors might find interesting, as it indicates it is forming a foundation inside a larger upward direction.
Technical Condition and Direction Study
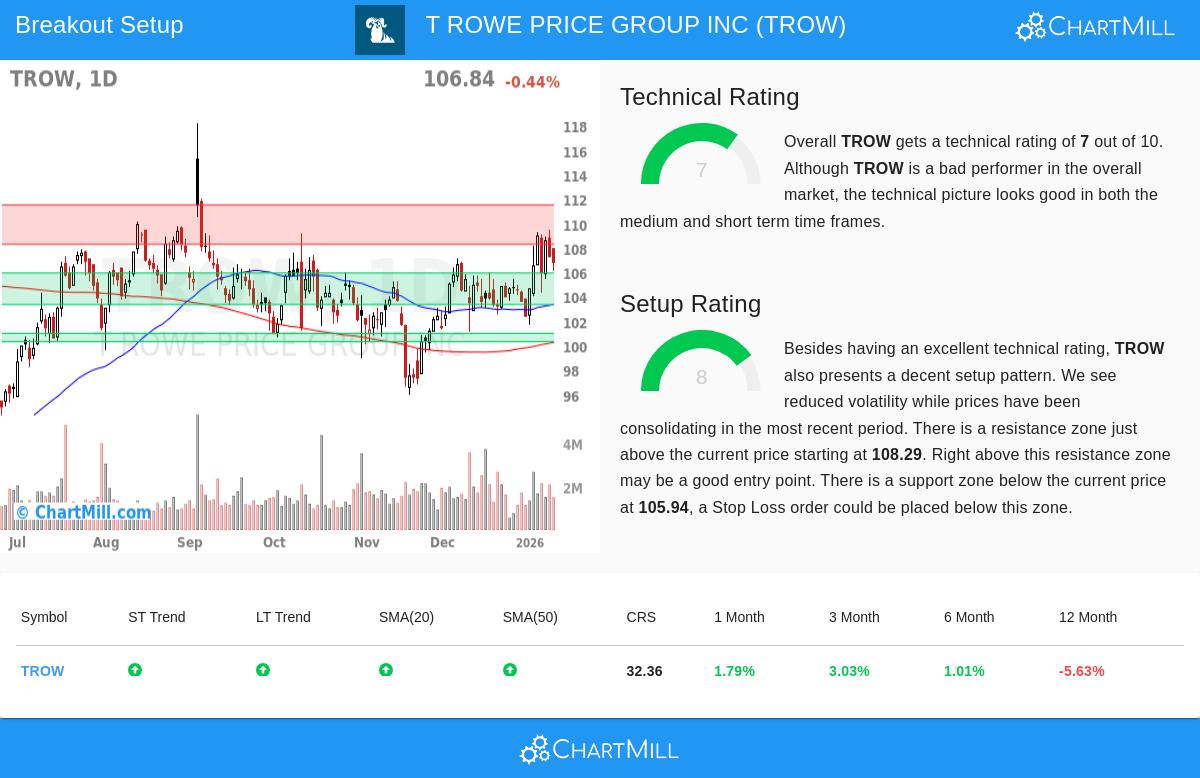
The base of a breakout formation is a stock showing firm technical condition. TROW's ChartMill Technical Rating of 7 out of 10 points to a stock in a confirmed upward direction. This score is backed by several important points from the detailed technical report:
- Positive Direction Agreement: Both the near-term and longer-term directions for TROW are now positive. This agreement across different periods is a good signal, indicating the stock's movement is not only a temporary rise but part of a longer move.
- Place Compared to Moving Averages: The stock is priced above its important simple moving averages (SMAs), like the 20-day, 50-day, 100-day, and 200-day SMAs. Also, all these averages are themselves in upward arrangements, which strengthens the positive direction structure.
- Performance Background: While TROW is trading in the higher part of its own 52-week span, it is notable the report states it has been behind the wider S&P 500 index, which is trading close to new peaks. This comparative lag might be seen as a stock that has held steady while the market rose, possibly creating a condition for an upward move if it breaks out.
This technical score is important for the breakout plan because it selects for stocks already in a clear upward direction. The aim is not to find a stock in decline or predict a turn at a low point, but to join in the ongoing move of a sound, current direction.
Formation Quality and Sideways Pattern
A positive direction by itself is not a signal to buy; entering a stock that has just risen quickly can result in quick declines. This is where the Setup Quality Rating becomes key. TROW's score of 8 points to a good sideways trading pattern, which addresses the important question of when to think about an entry.
The technical report states that TROW has been trading between about $101.72 and $109.45 over the last month and is now forming in the middle of this span. This time of lower change and sideways movement after an upward move is typical behavior that can come before a possible breakout. Important parts of the formation include:
- Clear Support and Resistance: The study finds definite technical levels.
- Support: An important support area is found between $103.36 and $105.94, made by a combination of trendlines and moving averages.
- Resistance: The nearby resistance area is between $108.29 and $111.52.
- Entry Point with Managed Risk: The formation proposes a possible trade entry just above the recent span, at $109.47, which would confirm a breakout above the sideways trading. A stop-loss order could then be set below the support area, near $103.35, setting the risk on the trade.
- Market Background: The current positive directions in both the near and long term for the S&P 500 give a good setting for stocks, which can raise the chance of successful breakouts in individual names like TROW.
This formation quality is the second main part of the plan. It finds times when a sound stock is pausing, letting investors plan a specific entry with a clear exit point if the expected breakout does not happen.
Summary
For technical investors, TROW shows a notable example of a stock that fits specific rules for a breakout formation. It has a sound technical base with positive directions across time periods, yet it has spent the last month in a period of sideways trading. This mix of condition (Technical Rating of 7) and forming action (Setup Rating of 8) creates a situation where a move above the set resistance could signal the start of its next upward part. As with all technical formations, confirmation of the breakout is important, and careful risk management using stop-loss orders stays necessary.
This study of TROW came from a systematic filter for technical breakout patterns. Investors searching for new, daily ideas that fit this approach can review the present list of stocks that qualify through the Technical Breakout Setups screen.
Disclaimer: This article is for information only and is not investment advice, a suggestion, or an offer to buy or sell any security. The study is based on technical indicators and past data, which are not promises of future results. Investors should do their own study and think about their personal money situation and risk comfort before making any investment choices.