
For investors who use technical analysis to find possible opportunities, a strict screening method is important. One useful plan involves selecting stocks that are both in a good technical upward move and are also making a helpful consolidation shape, indicating a possible breakout may be near. This method uses two special measures from ChartMill: the Technical Rating, which judges the general condition and direction of a stock, and the Setup Quality Rating, which judges the condition of its present price shape for a possible entry. By concentrating on stocks that rate well on both measures, traders try to place themselves in market leaders just as they start their next upward move.
TARGA RESOURCES CORP (NYSE:TRGP) recently appeared from such a screen, showing a profile that deserves more examination from market participants focused on technicals. The midstream energy company’s stock seems to be meeting the needed conditions for a possible technical breakout.
Judging the Technical Base
The first part of this plan is a good basic trend, which is measured by ChartMill’s Technical Rating. A high rating here is important because it shows the stock is in a confirmed upward move and is showing better performance, raising the chance that a breakout will continue instead of quickly failing.
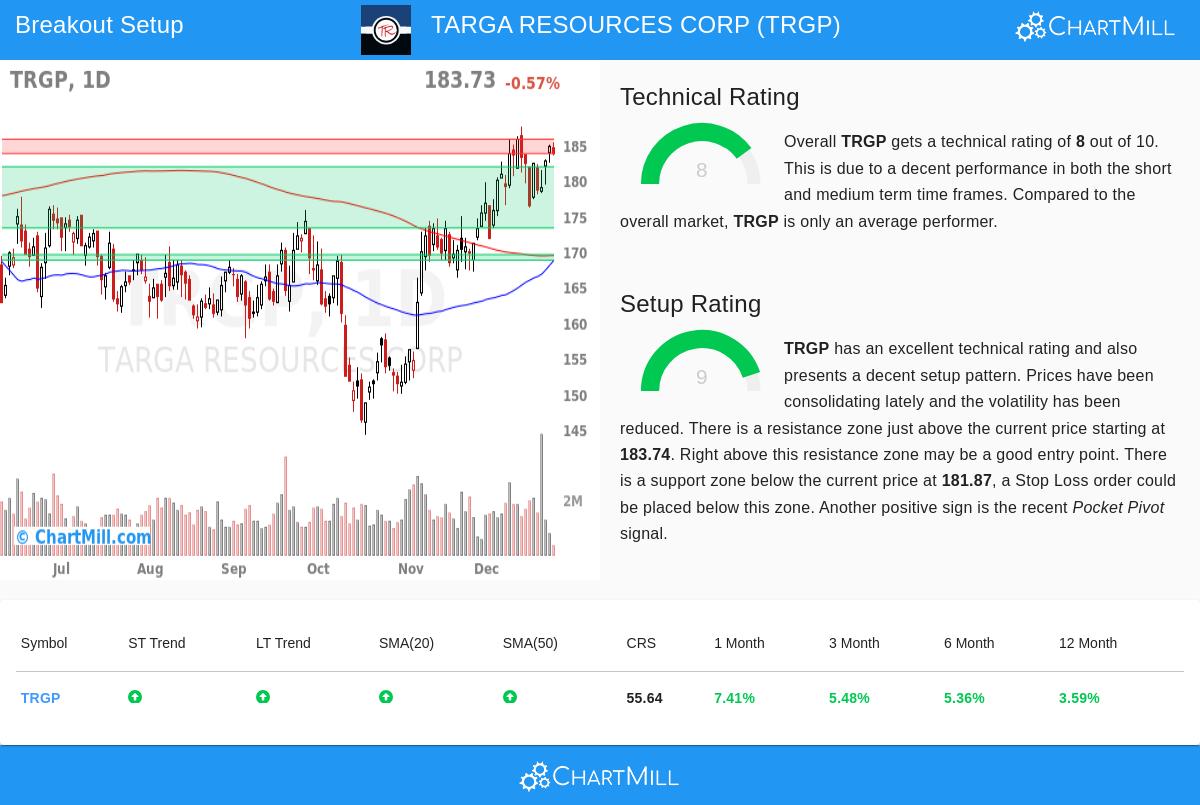
According to the detailed technical report, TRGP gets a good Technical Rating of 8 out of 10. This number is backed by several good points:
- Good Trend Agreement: Both the long-term and short-term trends for TRGP are now good. This agreement across time periods is a clear sign of a sound upward move.
- Good Moving Average Backing: The stock is priced above its important moving averages (20, 50, 100, and 200-day SMAs), and all these averages are themselves in upward arrangements. This makes a layered support structure below the price.
- Recent Results: The stock has shown positive movement over the last one, three, and six-month periods.
While the report mentions that TRGP’s results are about the same as the wider market over the past year, its good internal technical measures and strength compared to its industry point to a sound base.
Judging the Setup Condition
A strong trend by itself is not a sign to buy; entering during a steep rise has high danger. This is where the Setup Quality Rating becomes important. It finds times of consolidation or "tight" trading inside the upward move, which often come before the next important price move. A high setup number suggests a clear and lower-danger entry point with a set stop-loss level can be made.
TRGP does very well in this group with a top Setup Rating of 9. The examination points out a helpful shape that technical traders search for:
- Consolidation in an Upward Move: The stock has been trading in a range over the past month, letting it absorb its recent increases. This coiling action often builds pressure for the next directional move.
- Set Support and Resistance: The report finds clear technical levels. An important support area exists between about $173 and $182, made by a combination of moving averages and trendlines. Meanwhile, close resistance is seen in the $183.74 to $185.74 range.
- Lowered Volatility & Good Signs: The setup is marked by lowered volatility during the consolidation. Also, a recent "Pocket Pivot" sign, a volume-backed price move showing buying, was seen, adding a good catalyst to the technical view.
The mix of a good Technical Rating (8) and a high Setup Quality Rating (9) is exactly what the breakout screening method looks for. It shows TRGP is a technically sound stock that is pausing inside its upward move, possibly preparing for a new breakout.
A Possible Technical Situation
Based on this examination, a specific technical situation appears. The stock is now testing a resistance area just above its closing price of $183.73. A clear move above this area, especially a break above $185.75, could be seen by chart readers as the starting breakout sign. In such a situation, the earlier found support area near $182 down to $173 would work as a reasonable place for setting a protective stop-loss order, helping to control danger on the trade.
For investors wanting to find similar possible breakout setups, new results from the Technical Breakout screen are made daily and can be found here.
Disclaimer: This article is for information only and does not make up investment advice, an approval, or a suggestion to buy, sell, or hold any security. The technical examination and possible trade setup described are based on automated measures and past price behavior, which are not promises of future results. Always do your own research, think about your personal danger tolerance, and talk with a qualified financial advisor before making any investment choices.