
Tapestry Inc (NYSE:TPR) has appeared as a notable technical breakout candidate after a systematic screening process that finds stocks displaying both good technical health and consolidation patterns. This method uses two specific indicators: the ChartMill Technical Rating, which measures a stock's overall technical condition, and the Setup Quality Rating, which checks if the stock is building a proper consolidation base that might come before a notable price move. Stocks with high scores on both measures frequently offer good risk-reward profiles for technical traders looking for breakout chances.
Technical Strength Assessment
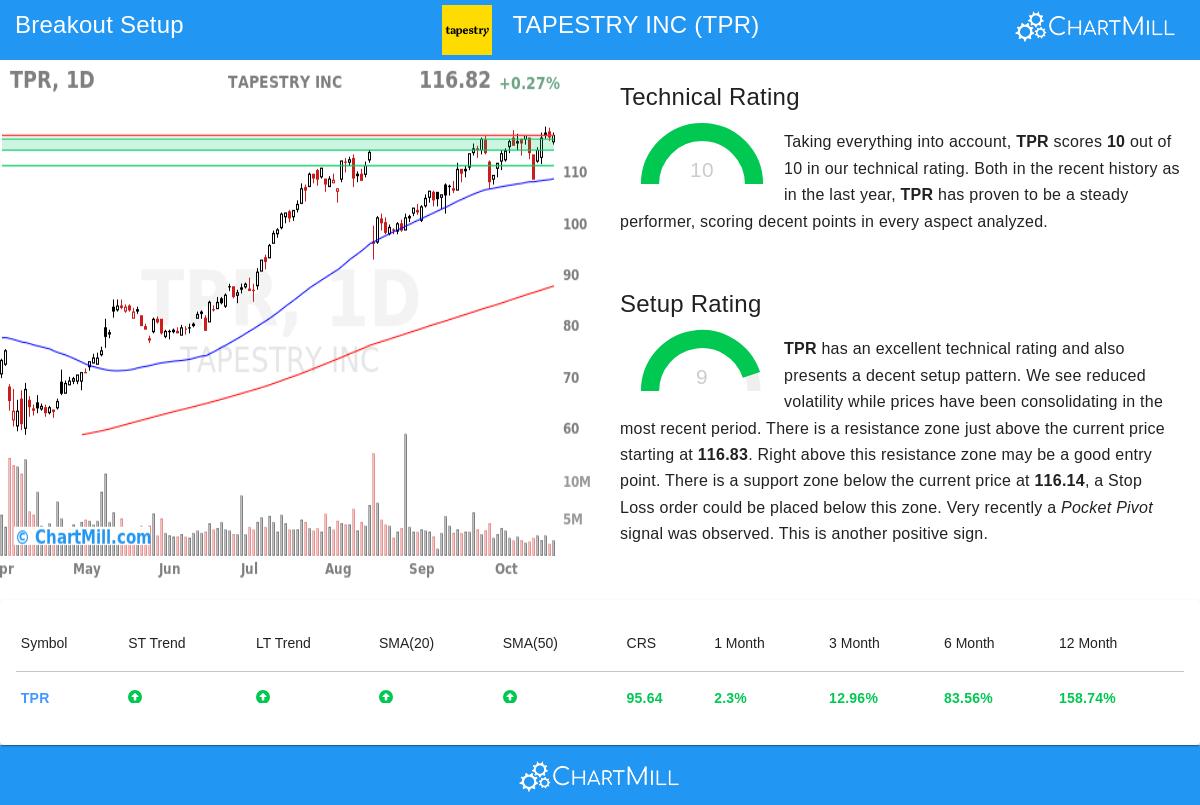
Tapestry shows very good technical features that place it as a market leader in its sector. The stock gets a perfect Technical Rating of 10, showing solid performance over different timeframes and technical measures. This high rating comes from a few main factors that match the method's focus on finding stocks with good technicals before looking at entry points.
The stock's trend structure is notable across all checked timeframes:
- Both short-term and long-term trends are clearly positive
- Price trades well above all main moving averages (20-day: $113.94, 50-day: $108.38, 100-day: $100.79, 200-day: $87.46)
- Relative strength is much better than the wider market, doing better than 95% of all stocks
Sector leadership adds to Tapestry's technical advantage. In the Textiles, Apparel & Luxury Goods industry with 48 stocks, Tapestry does better than 100% of its competitors. The stock's notable 158.7% twelve-month performance shows continued momentum instead of single spikes, with gains spread evenly over the time. This technical base gives the needed background for thinking about breakout potential, as stocks with good trends tend to make the most dependable breakout moves.
Setup Quality Analysis
With a Setup Rating of 9, Tapestry shows a notable consolidation pattern that gives traders a specific risk structure. The setup quality measure deals with the important question of timing by finding periods where volatility decreases and prices settle in a small range, possibly before the next price move.
Current price action shows a few features of a high-grade setup:
- Recent trading range between $106.26 and $118.56 shows consolidation after prior gains
- Lower volatility makes conditions for a possible volatility increase
- Several support areas give clear stop-loss levels, especially at $116.14
- A recent pocket pivot signal shows institutional buying
The consolidation pattern has developed just below a specific resistance zone at $116.83, creating a possible springboard effect. This technical setup lets traders use exact entry and exit plans, with a proposed entry at $116.84 (above resistance) and stop-loss at $113.93 (below support). The 2.49% risk per trade is within acceptable limits for breakout plans, while the closeness to important technical levels offers a good risk-reward profile.
Market Context and Considerations
While Tapestry's technical profile seems solid, traders should note a few context factors. The lower volume during recent consolidation, though normal during base formations, needs watching for confirmation on any breakout try. The current positive short-term trend in the S&P500 gives a good background for breakout plans, though Tapestry's performance is much better than the wider market's neutral long-term trend.
The stock's high place near its 52-week high of $118.56 usually needs careful position sizing, though the specific support structure helps limit downside risk. The Average True Range of 3.55 shows enough daily movement to get meaningful gains while allowing for sensible stop placements.
Looking at Other Opportunities
For investors searching for similar technical breakout candidates, the Technical Breakout Setups screen regularly finds stocks meeting these strict technical and setup rules. This systematic method helps traders effectively find possible chances across market sectors.
Disclaimer: This analysis is based on technical indicators and historical price patterns and should not be considered investment advice. The mentioned trade setup is provided for educational purposes only. Always conduct your own research, consider your risk tolerance, and consult with a financial advisor before making any investment decisions. Technical analysis does not guarantee future performance and should be used as one component of a complete investment strategy.