
Our stock screener has spotted TRI POINTE HOMES INC (NYSE:TPH) as an undervalued stock with solid fundamentals. TPH shows decent health and profitability. At the same time it remains remains attractively priced. We'll dive into each aspect below.
Valuation Examination for TPH
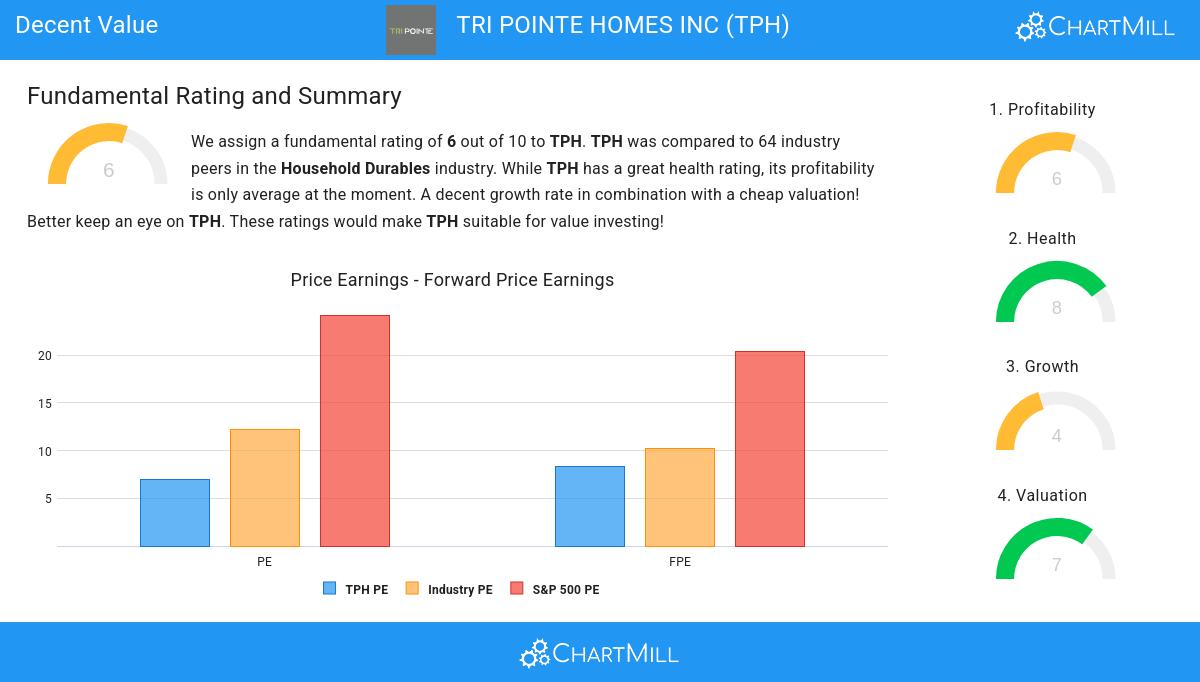
To assess a stock's valuation, ChartMill utilizes a Valuation Rating on a scale of 0 to 10. This comprehensive assessment considers various valuation aspects, comparing price to earnings and cash flows, while factoring in profitability and growth. TPH has achieved a 7 out of 10:
- Based on the Price/Earnings ratio of 6.99, the valuation of TPH can be described as very cheap.
- Based on the Price/Earnings ratio, TPH is valued a bit cheaper than the industry average as 70.31% of the companies are valued more expensively.
- Compared to an average S&P500 Price/Earnings ratio of 24.21, TPH is valued rather cheaply.
- Based on the Price/Forward Earnings ratio of 8.37, the valuation of TPH can be described as reasonable.
- Based on the Price/Forward Earnings ratio, TPH is valued a bit cheaper than 65.63% of the companies in the same industry.
- TPH is valuated cheaply when we compare the Price/Forward Earnings ratio to 20.44, which is the current average of the S&P500 Index.
- Based on the Enterprise Value to EBITDA ratio, TPH is valued cheaper than 90.63% of the companies in the same industry.
- Based on the Price/Free Cash Flow ratio, TPH is valued cheaper than 96.88% of the companies in the same industry.
- The decent profitability rating of TPH may justify a higher PE ratio.
Exploring TPH's Profitability
ChartMill utilizes a Profitability Rating to assess stocks, scoring them on a scale of 0 to 10. This rating takes into account a variety of profitability ratios and margins, both in absolute terms and in comparison to industry peers. TPH has earned a 6 out of 10:
- TPH has a better Return On Assets (9.36%) than 67.19% of its industry peers.
- TPH has a Return On Invested Capital of 9.82%. This is in the better half of the industry: TPH outperforms 62.50% of its industry peers.
- With a decent Profit Margin value of 10.19%, TPH is doing good in the industry, outperforming 78.13% of the companies in the same industry.
- In the last couple of years the Profit Margin of TPH has grown nicely.
- The Operating Margin of TPH (12.84%) is better than 73.44% of its industry peers.
- TPH's Operating Margin has improved in the last couple of years.
- TPH's Gross Margin has improved in the last couple of years.
A Closer Look at Health for TPH
ChartMill assigns a proprietary Health Rating to each stock. The score is computed by evaluating various liquidity and solvency ratios and ranges from 0 to 10. TPH was assigned a score of 8 for health:
- An Altman-Z score of 4.28 indicates that TPH is not in any danger for bankruptcy at the moment.
- With a decent Altman-Z score value of 4.28, TPH is doing good in the industry, outperforming 68.75% of the companies in the same industry.
- The Debt to FCF ratio of TPH is 1.52, which is an excellent value as it means it would take TPH, only 1.52 years of fcf income to pay off all of its debts.
- The Debt to FCF ratio of TPH (1.52) is better than 75.00% of its industry peers.
- A Debt/Equity ratio of 0.31 indicates that TPH is not too dependend on debt financing.
- TPH has a Current Ratio of 8.21. This indicates that TPH is financially healthy and has no problem in meeting its short term obligations.
- TPH has a Current ratio of 8.21. This is amongst the best in the industry. TPH outperforms 85.94% of its industry peers.
- TPH has a Quick Ratio of 2.10. This indicates that TPH is financially healthy and has no problem in meeting its short term obligations.
- The Quick ratio of TPH (2.10) is better than 87.50% of its industry peers.
Exploring TPH's Growth
To evaluate a stock's growth potential, ChartMill utilizes a Growth Rating on a scale of 0 to 10. This comprehensive assessment considers various growth aspects, including historical and estimated EPS and revenue growth. TPH has achieved a 4 out of 10:
- TPH shows a strong growth in Earnings Per Share. In the last year, the EPS has been growing by 20.00%, which is quite good.
- Measured over the past years, TPH shows a very strong growth in Earnings Per Share. The EPS has been growing by 26.86% on average per year.
- Looking at the last year, TPH shows a very strong growth in Revenue. The Revenue has grown by 20.93%.
More Decent Value stocks can be found in our Decent Value screener.
Our latest full fundamental report of TPH contains the most current fundamental analsysis.
Disclaimer
This is not investing advice! The article highlights some of the observations at the time of writing, but you should always make your own analysis and invest based on your own insights.