
Discover TRI POINTE HOMES INC (NYSE:TPH)—an undervalued stock our stock screener has picked out. TPH demonstrates solid fundamentals, including health and profitability, all while staying attractively priced. Let's explore the details.
Valuation Analysis for TPH
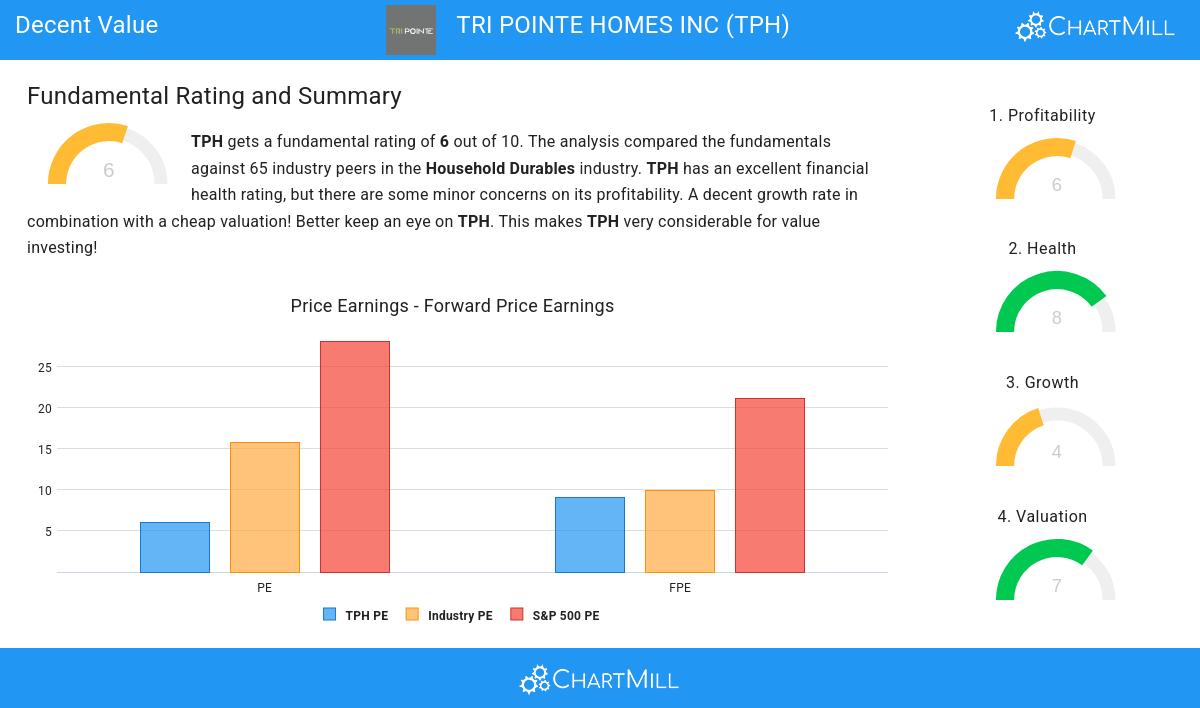
An integral part of ChartMill's stock analysis is the Valuation Rating, which spans from 0 to 10. This rating evaluates diverse valuation factors, including price to earnings and cash flows, while considering the stock's profitability and growth. TPH has received a 7 out of 10:
- A Price/Earnings ratio of 6.05 indicates a rather cheap valuation of TPH.
- Based on the Price/Earnings ratio, TPH is valued cheaply inside the industry as 84.62% of the companies are valued more expensively.
- Compared to an average S&P500 Price/Earnings ratio of 28.15, TPH is valued rather cheaply.
- The Price/Forward Earnings ratio is 9.09, which indicates a very decent valuation of TPH.
- TPH's Price/Forward Earnings ratio indicates a rather cheap valuation when compared to the S&P500 average which is at 21.10.
- TPH's Enterprise Value to EBITDA ratio is rather cheap when compared to the industry. TPH is cheaper than 90.77% of the companies in the same industry.
- 95.38% of the companies in the same industry are more expensive than TPH, based on the Price/Free Cash Flow ratio.
- TPH has a very decent profitability rating, which may justify a higher PE ratio.
Exploring TPH's Profitability
ChartMill's Profitability Rating offers a unique perspective on stock analysis, providing scores from 0 to 10. These ratings consider a wide range of profitability metrics and margins, both in comparison to industry peers and on their own merits. For TPH, the assigned 6 is a significant indicator of profitability:
- TPH's Return On Assets of 9.36% is fine compared to the rest of the industry. TPH outperforms 67.69% of its industry peers.
- TPH's Return On Invested Capital of 9.82% is fine compared to the rest of the industry. TPH outperforms 61.54% of its industry peers.
- TPH has a Profit Margin of 10.19%. This is in the better half of the industry: TPH outperforms 78.46% of its industry peers.
- TPH's Profit Margin has improved in the last couple of years.
- TPH has a better Operating Margin (12.84%) than 75.38% of its industry peers.
- TPH's Operating Margin has improved in the last couple of years.
- TPH's Gross Margin has improved in the last couple of years.
Health Analysis for TPH
A critical element of ChartMill's stock evaluation is the Health Rating, which spans from 0 to 10. This rating considers multiple health factors, including liquidity and solvency, both in absolute terms and relative to industry peers. TPH has received a 8 out of 10:
- TPH has an Altman-Z score of 4.20. This indicates that TPH is financially healthy and has little risk of bankruptcy at the moment.
- The Altman-Z score of TPH (4.20) is better than 69.23% of its industry peers.
- The Debt to FCF ratio of TPH is 1.52, which is an excellent value as it means it would take TPH, only 1.52 years of fcf income to pay off all of its debts.
- The Debt to FCF ratio of TPH (1.52) is better than 75.38% of its industry peers.
- TPH has a Debt/Equity ratio of 0.31. This is a healthy value indicating a solid balance between debt and equity.
- TPH has a Current Ratio of 8.21. This indicates that TPH is financially healthy and has no problem in meeting its short term obligations.
- Looking at the Current ratio, with a value of 8.21, TPH belongs to the top of the industry, outperforming 84.62% of the companies in the same industry.
- A Quick Ratio of 2.10 indicates that TPH has no problem at all paying its short term obligations.
- Looking at the Quick ratio, with a value of 2.10, TPH belongs to the top of the industry, outperforming 83.08% of the companies in the same industry.
How do we evaluate the Growth for TPH?
To evaluate a stock's growth potential, ChartMill utilizes a Growth Rating on a scale of 0 to 10. This comprehensive assessment considers various growth aspects, including historical and estimated EPS and revenue growth. TPH has achieved a 4 out of 10:
- The Earnings Per Share has grown by an impressive 40.00% over the past year.
- TPH shows a strong growth in Earnings Per Share. Measured over the last years, the EPS has been growing by 26.86% yearly.
- Looking at the last year, TPH shows a very strong growth in Revenue. The Revenue has grown by 20.93%.
Every day, new Decent Value stocks can be found on ChartMill in our Decent Value screener.
Check the latest full fundamental report of TPH for a complete fundamental analysis.
Keep in mind
Important Note: The content of this article is not intended as trading advice. It is essential to perform your own analysis and exercise caution when making trading decisions. The article presents observations created by automated analysis but does not guarantee any trading or investment outcomes. Always trade responsibly and make independent judgments.