
For investors who use technical analysis to find possible opportunities, a common method looks for stocks that are both in good technical condition and ready to move out of a period of sideways trading. This method aims to join the momentum of a stock in a clear upward move with the attractive profile of a specific entry point. One way to find these situations is to search for stocks showing a high technical condition score together with a high pattern quality score, which points to a time of tightening price movement. A recent search using this approach has identified TPG INC (NASDAQ:TPG) as a stock that fits these conditions.
Technical Condition: A Firm Base
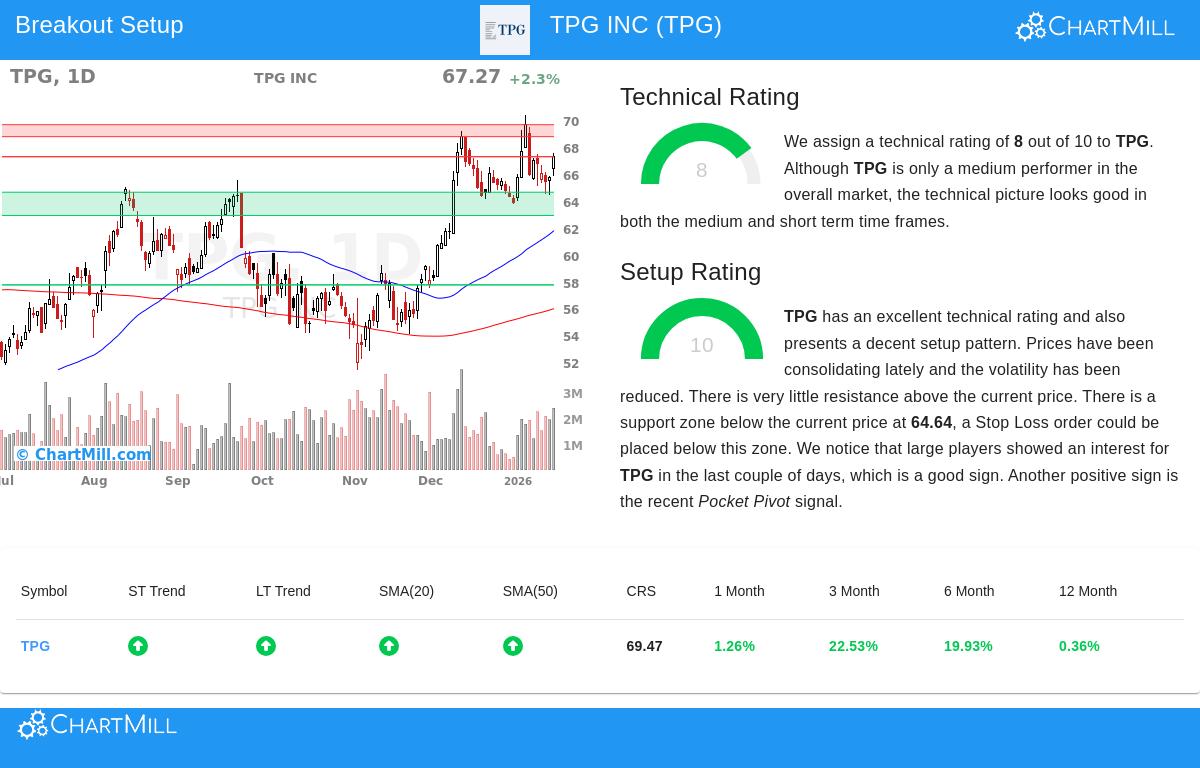
The first part of this strategy is finding stocks with good underlying technical condition. A high technical rating implies the stock is in a steady upward move and is doing better than similar stocks, giving a positive condition for any attempted move higher. Based on the detailed technical report, TPG receives a technical rating of 8 out of 10, putting it clearly in the "uptrend" group.
Important parts adding to this score are:
- Positive Trend Direction: Both the recent and longer-term trends for TPG are rated as positive, a pairing that shows steady buying interest across different time frames.
- Good Performance Comparison: In the Capital Markets industry, TPG is performing better than 74% of its 235 peers. This comparative performance is a sign of industry leadership.
- Supportive Price Averages: The stock is priced above all its main simple moving averages (20, 50, 100, and 200-day), and each of these averages is itself moving higher. This layered arrangement of support levels is a standard feature of a good upward move.
This technical environment is important because it raises the chance that a move higher, if it happens, will continue instead of quickly fading. A move out of a weak stock is frequently a false signal, but a move out of a technically sound stock like TPG has more weight.
Pattern Quality: The Sideways Trading Before the Shift
While technical condition shows which stock to monitor, the pattern quality answers when to think about an entry. A high pattern score shows the stock is in a period of sideways trading, or moving in a fairly narrow band, after a previous rise. This tightening action often comes before the next price move. TPG shows a pattern quality score of 10, the highest available.
The analysis indicates several features of this positive period of sideways trading:
- Lower Price Swings: The report states that price movement has lessened recently, a common indicator of balance between buyers and sellers before a change.
- Nearness to Price Averages: The present price is trading close to important recent moving averages, keeping the stock from becoming too far from its average and so lowering near-term downside possibility.
- Defined Support and Resistance: A clear support area exists between $62.91 and $64.64, made by a combination of trendlines and moving averages. Just above, a resistance level is seen near $67.28. This makes a clear structure for trade planning.
- Large Trader Activity: The report points out that large traders have been active in TPG recently, and a "Pocket Pivot" signal—a price move with higher volume within a base—was seen very recently. These are often seen as signs of buying interest.
For a technical trader, this high-grade pattern is key. It gives a reasonable area to set a protective stop-loss order (below the defined support) and a specific level to watch for a move higher signal (above resistance). The tight sideways trading improves the possible gain-to-risk measure of the trade.
A Possible Move Higher Situation
Combining the technical condition and the pattern quality, the automated analysis proposes a specific trading situation. The suggested entry point is a move above the $67.29 resistance level, which would signal a possible exit from the sideways trading phase. A stop-loss order is proposed below the recent range at $63.99, using the identified support area to set the trade's risk. The space between these two points represents a risk of about 4.9% on the trade itself.
It is important to note that this is a created example based only on price movement. Traders should always do their own analysis, thinking about elements like general market environment—presently, the S&P 500 shows positive long and short-term trends—and any company-specific news or coming events like earnings reports.
Finding Other Possibilities
The move higher pattern in TPG was found using a systematic filter that looks for high technical and pattern ratings. This process can be done daily to find new possible opportunities as the market changes.
For investors wanting to see the present list of stocks showing similar technical move higher patterns, you can view the live filter here.
Disclaimer: This article is for information only and is not investment advice, a suggestion, or an offer or request to buy or sell any securities. The trading situation discussed is created automatically from technical indicators and is not a promise of future results. All investing and trading has risk, including the possible loss of principal. Always do your own research and think about talking with a qualified financial professional before making any investment choices. Past results do not guarantee future outcomes.