
Tencent Music Entertainment Group (NYSE:TME) has appeared as a notable candidate in the Technical Breakout Setups screen, a process made to find stocks with both good basic technical condition and positive consolidation patterns. This method uses two specific metrics: the ChartMill Technical Rating, which measures trend force and comparative performance, and the Setup Quality Rating, which checks for a clear, stable base that might come before a large price change. Stocks with high marks in both areas are seen as leading choices for breakout trading plans, as they show market frontrunners set for possible upward movement.
Technical Force and Market Standing
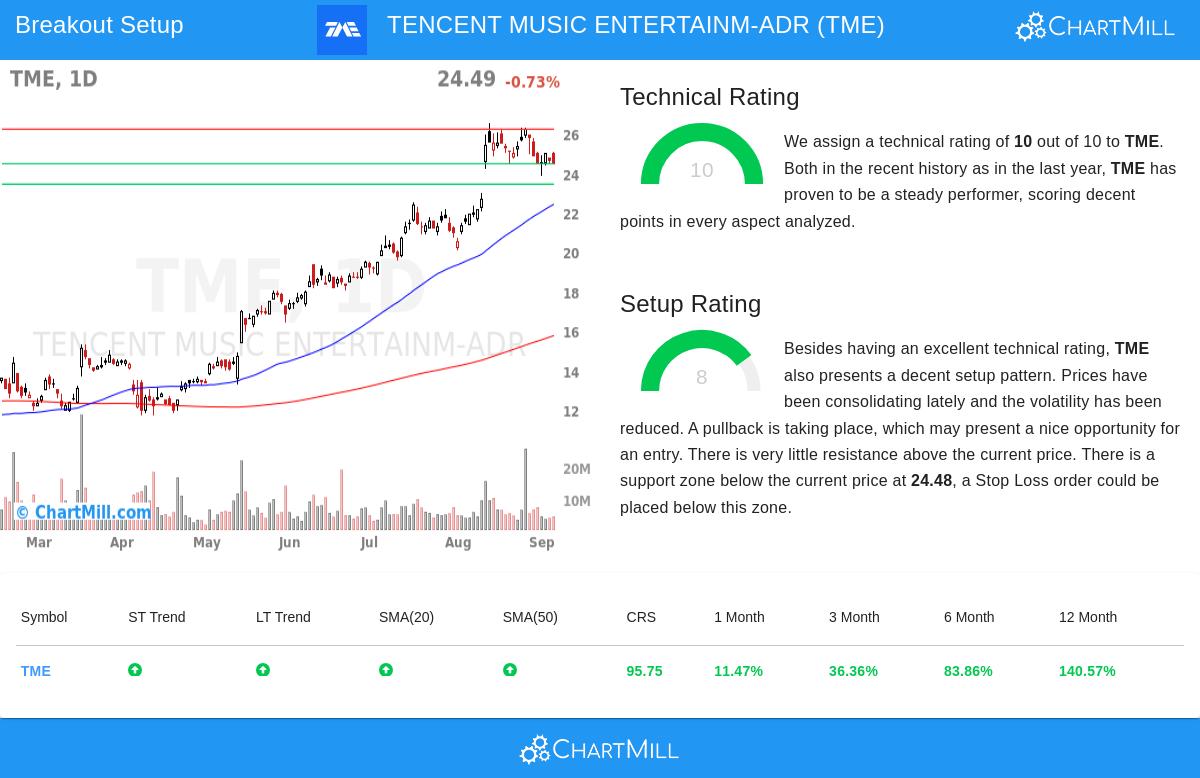
Tencent Music Entertainment shows very good technical force, receiving a top Technical Rating of 10. This rating shows high-quality performance across various time periods and technical measures. The stock displays strong comparative force, doing better than 95% of all stocks over the last year and placing in the best 4% within the active Entertainment field. Both recent and extended trends stay clearly positive, with the stock trading well above its important moving averages. The 20-day, 50-day, 100-day, and 200-day simple moving averages are all moving up, confirming the force of the present momentum. This technical quality is especially notable given the stock's strong yearly gain of 140.57%, reached through steady increases instead of single jumps.
Setup Quality and Consolidation Pattern
Adding to its technical force, Tencent Music shows a positive setup pattern with a Setup Rating of 8. The stock has been moving in a fairly narrow band, displaying lower volatility while keeping its place near the high point of its 52-week range. This movement has formed what technical experts see as a bull flag pattern, usually happening after a solid rise and frequently coming before another upward step. The setup gives clear support points, with the main support area found between $24.48 and $24.48, made by several trend lines across different timeframes. This clear support makes a reasonable area for setting protective stop-loss orders, a key part in risk-controlled breakout trading.
Trading Points and Market Conditions
The present technical arrangement indicates a possible entry point near $25.13, just above the 10-day moving average, with a stop-loss point around $24.47. This setup gives a positive risk-reward situation with a measured risk of about 2.63% from entry to stop-loss. The stock's average daily volume of over 6.2 million shares guarantees sufficient liquidity for position entry and exit. While the S&P 500 displays positive trends in both recent and extended views, TME's technical features indicate it may provide alpha creation possibility beyond general market performance. The existence of little resistance above present prices further backs the breakout idea, as any move above consolidation levels might meet limited selling pressure.
For investors looking for more technical breakout chances, the Technical Breakout Setups screen gives daily updated results based on the same process that found TME's possibility. Readers can view the full technical analysis report for Tencent Music Entertainment Group here for more specific information on support/resistance points and other technical measures.
Disclaimer: This analysis uses technical measures and historical performance patterns and should not be seen as investment advice. All investments have risk, and past performance does not ensure future outcomes. Readers should do their own research and talk with a qualified financial advisor before making any investment decisions.