
The process of identifying stocks with strong growth potential often involves a blend of rigorous technical and fundamental analysis. One systematic approach that represents this philosophy is the strategy used by trader Mark Minervini, which uses a specific Trend Template to find stocks in strong, established uptrends. This method is frequently paired with searches for strong-growth momentum, seeking companies that are not only technically sound but also showing improving business fundamentals. The goal is to find leaders early in their major price increases, where the alignment of a strong chart and solid earnings growth creates a good risk/reward scenario.
TransMedics Group Inc (NASDAQ:TMDX) recently appeared from a search made to find such opportunities, filtering for stocks that meet Minervini's Trend Template while also having a strong-growth momentum rating. This pairing indicates the medical technology company may be showing the kind of traits growth-focused investors and trend followers search for.
Reviewing the Technical Trend
At its center, the Minervini Trend Template is made to filter out stocks in weak or resting phases, concentrating only on those in clear, maintained uptrends. The rules enforce discipline by demanding specific alignments of key moving averages and price action compared to yearly highs and lows.
A look at TransMedics' chart shows it currently fits these strict technical conditions:
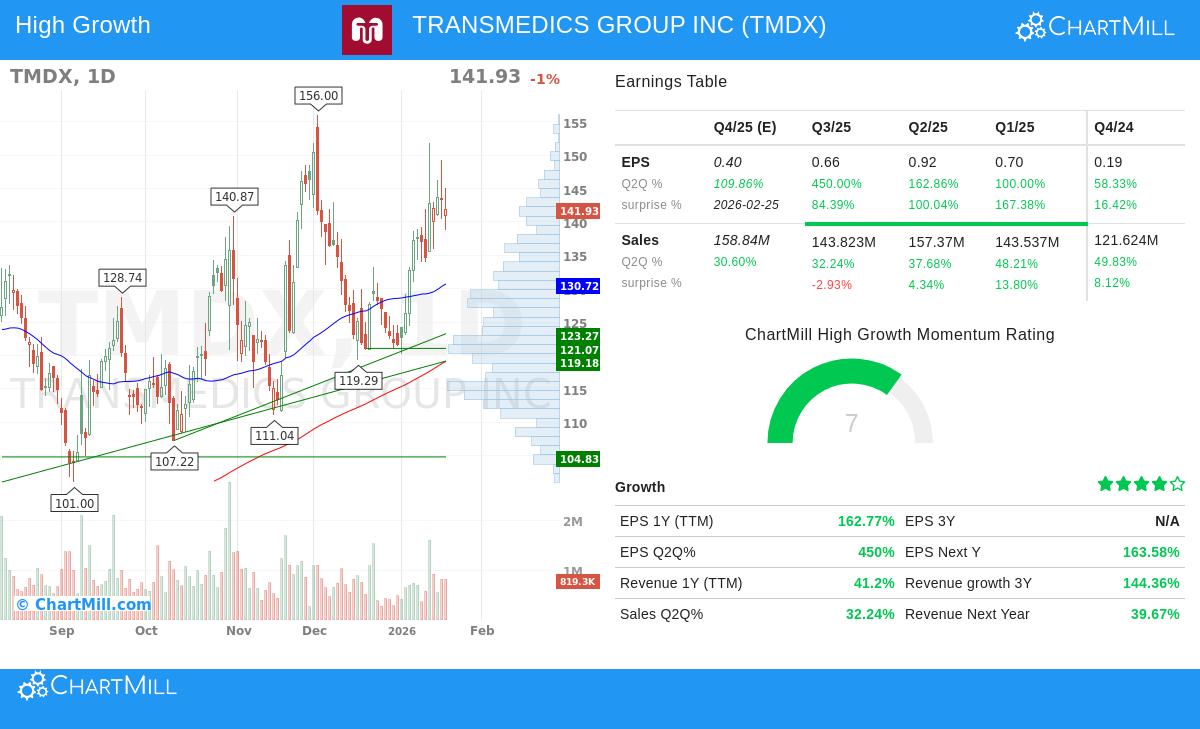
- Price vs. Moving Averages: The stock is trading well above its rising 50-day ($130.72), 150-day ($123.17), and 200-day ($119.16) simple moving averages. This arrangement of price above rising averages is a classic sign of a sound long-term uptrend.
- Moving Average Alignment: The shorter-term 50-day moving average is placed above both the 150-day and 200-day averages, while the 150-day is above the 200-day. This "bullish order" confirms improving momentum across multiple timeframes, a key part of the template.
- Proximity to Highs: With a current price around $141.93, TMDX is trading within 10% of its 52-week high of $156.00, comfortably inside the template's requirement of being within 25% of the high. At the same time, the price is over 139% above its 52-week low, far exceeding the 30% threshold. This shows strong recovery momentum and a position of leadership.
- Relative Strength: The stock has a ChartMill Relative Strength (CRS) rating of 95.47, meaning it has performed better than approximately 95% of the market over the past year. High relative strength is a foundation of the Minervini approach, as it finds market leaders that often continue to lead.
This technical view fits with a market where the S&P 500's short-term trend is positive, providing a supportive setting for trending stocks to continue their rises.
Reviewing Strong-Growth Fundamentals
While a sound chart is necessary, the Minervini strategy places important weight on the fundamental engine moving the price action. The "strong growth momentum" part of the search looks for companies with improving earnings and sales, which are often the reasons for maintained price increases. TransMedics' recent financial performance points out several of these growth features.
- Earnings Improvement: The company has shown notable and improving bottom-line growth. Year-over-year EPS growth rose from 58.3% three quarters ago to 100%, then 162.9%, and most recently to 450% in the latest quarter. This pattern of improvement is a strong sign of increasing business momentum.
- Consistent Earnings Surprises: TMDX has exceeded analyst EPS estimates in all of the last four quarters, with an average beat of over 92%. This consistent better performance builds trust with investors and can lead to positive estimate changes.
- Sound Sales Growth: Revenue growth remains strong, with the last quarter showing a 32.2% year-over-year increase. This follows several quarters of even higher growth, showing the company's top-line expansion is on a firm path.
- Improving Profitability: Perhaps most importantly, this sales growth is changing into much better profitability. The company's profit margin has grown sequentially over recent quarters, reaching 16.9% last quarter, up from 5.6% three quarters before. This margin growth is a sign of a business operating efficiently and is a key reason for earnings growth.
Technical Condition and Setup Summary
According to ChartMill's own analysis, TransMedics receives a perfect Technical Rating of 10 out of 10, reflecting very good technical condition. The report states the long and short-term trends are both positive and that TMDX is performing better than most stocks in both the wider market and its Health Care Equipment & Supplies industry. The main note from the analysis relates to the current trade setup. With a Setup Rating of 5, the stock's recent price movement has been somewhat unstable, suggesting it may be in a resting phase rather than at an immediate breakout point. For traders following a strict Minervini-style entry, this shows a need for patience to find a lower-risk entry point, such as a period of reduced price movement, before a new rise. You can see the full, detailed technical breakdown in the ChartMill Technical Report for TMDX.
Searching for Similar Opportunities
TransMedics presents a case study in a stock that fits with a disciplined growth and momentum strategy, meeting criteria for both technical trend strength and fundamental improvement. For investors interested in searching for similar candidates that meet the Minervini Trend Template and show strong-growth momentum, you can examine the predefined search here.
Disclaimer: This article is for informational and educational purposes only and is not intended as investment advice. The analysis of TransMedics Group Inc. (TMDX) is based on provided data and a specific search method. It does not constitute a recommendation to buy, sell, or hold any security. Investors should conduct their own thorough research and consider their individual financial situation and risk tolerance before making any investment decisions. Past performance is not indicative of future results.