
The method used to find possible investment choices joins a strict technical structure with attention to fundamental growth momentum. This process is guided by the ideas of well-known trader Mark Minervini, whose Trend Template is made to find stocks showing solid, confirmed uptrends. The template applies a sequence of moving average arrangements and price levels to confirm a stock is in a verified Stage 2 advance, therefore trading with the existing momentum. To add to this technical position, the filter applies a High Growth Momentum (HGM) rating, which measures a company's latest and expected earnings and sales growth, speed of growth, and analyst outlook. This two-step filtering method seeks to locate companies that are both technically set for further progress and supported by getting better business foundations, a pairing frequently observed in market leaders.
Technical Position with the Minervini Trend Template
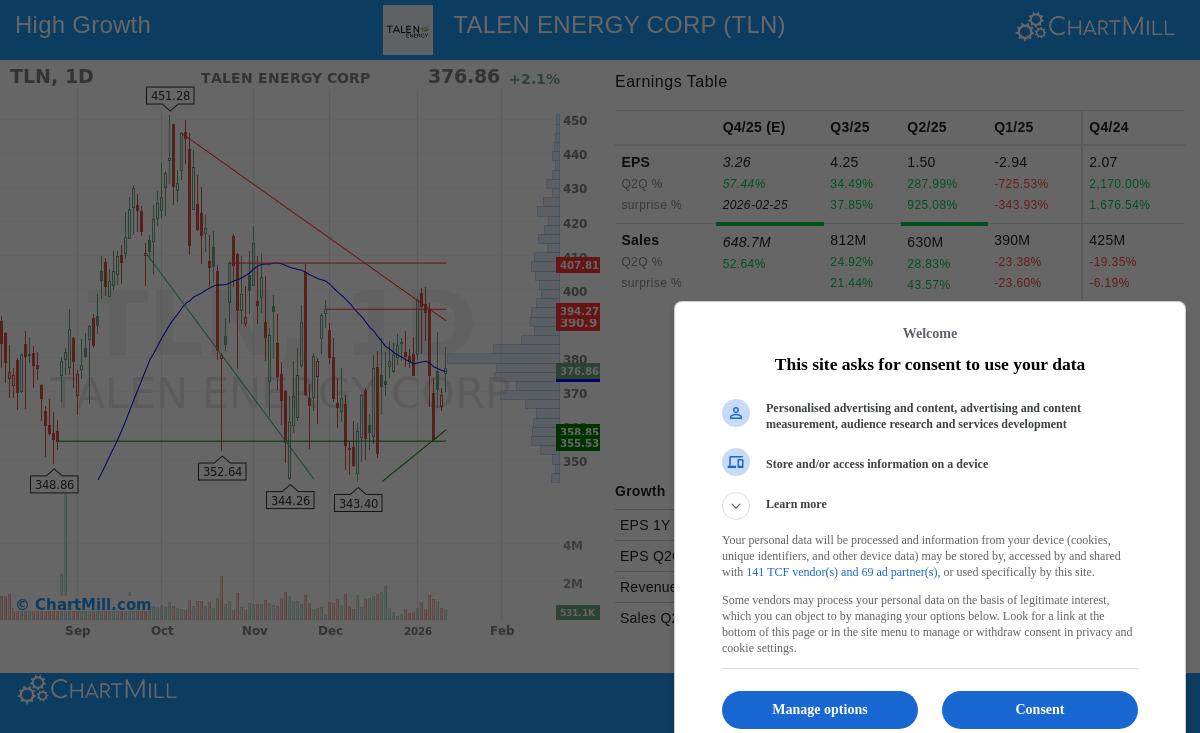
Talen Energy Corp. (NASDAQ:TLN) shows a notable technical picture that matches various main parts of the Minervini Trend Template. This template highlights trading in line with a stock's main trend to benefit from momentum.
- Trending Moving Averages: The stock's price is now located above its 50-day ($375.95), 150-day ($366.75), and 200-day ($330.70) simple moving averages (SMAs). This ordered arrangement is a standard indicator of a sound uptrend across several time periods.
- Positive Long-Term Trend: Both the 150-day and 200-day SMAs have an upward slope, verifying the long-term positive trend. The 200-day SMA, an important measure for institutional investors, has moved from about $329.82 to its present point, indicating continued buying activity over the last year.
- Nearness to Highs: A central idea of the Minervini method is to concentrate on strength, not weakness. TLN's present price is trading in the higher part of its 52-week range, which goes from $158.08 to $451.28. While not inside the exact 25% of its high, its major recovery from the low and stabilization close to recent highs points to existing strength.
- Better Relative Strength: With a ChartMill Relative Strength (CRS) score of 86.2, TLN has done better than about 86% of all stocks over the last year. High relative strength is a key feature of market leadership and shows the stock is drawing investment even when wider markets might be struggling.
Fundamental Growth Momentum
Beyond the price chart, TLN displays traits that interest growth-focused investors. The High Growth Momentum rating assesses the speed and quality of a company's financial results.
- Solid Recent Earnings Growth: The company has displayed a notable quickening in its latest quarterly results. Earnings per share (EPS) increased by 34.5% compared to the same quarter last year, a clear gain that suggests positive business momentum.
- Sound Profitability: TLN keeps good profit margins. The last reported quarter showed a net profit margin of 25.5%, signifying efficient operations and pricing ability in its industry.
- Positive Analyst Changes: Future projections are moving higher. Analyst agreement for next year's EPS has been adjusted upward by 3.75% over the last three months, showing increasing belief in the company's future earnings capacity. In the same way, revenue projections for the next year have been increased by almost 3%.
- Cash Flow Production: The company is producing significant free cash flow, with $7.33 per share over the last twelve months. This offers financial room for projects, debt paydown, or possible returns to shareholders.
Technical Analysis Summary
An examination of the detailed technical report for TLN gives it a combined technical rating of 6 out of 10. The report states that while TLN was a leading performer in the past year, recent indicators have turned varied in the nearer term. The long-term trend stays positive, but the short-term trend is now neutral. The stock is trading in a stabilization area between about $350 and $401, which has assisted in lowering instability and could be setting a foundation for its next direction. Important support is seen around the $355-$359 area, while above resistance is near $391-$397.
Finding Similar Opportunities
The pairing of a Minervini-style trend formation and high-growth foundations can be a strong filter for spotting possible leaders. Investors searching to locate other securities that fit this particular mix of technical and fundamental measures can examine the pre-set screen: High Growth Momentum + Trend Template.
Disclaimer: This article is for informational and educational purposes only. It does not constitute investment advice, a recommendation, or an offer to buy or sell any security. The analysis is based on data provided and certain methodologies, but past performance is not indicative of future results. Investors should conduct their own due diligence and consult with a qualified financial advisor before making any investment decisions. Please read our full disclaimer here.