
Our stock screener has detected a potential breakout setup on TKO GROUP HOLDINGS INC (NYSE:TKO). This breakout pattern is observed when a stock consolidates following a strong upward movement. It's important to note that this pattern is based on technical analysis, and the actual breakout outcome is uncertain. However, it might be worth keeping an eye on NYSE:TKO.
Zooming in on the technicals.
ChartMill utilizes a proprietary algorithm to assign a Technical Rating to every stock. This rating, ranging from 0 to 10, is computed daily by analyzing a variety of technical indicators and properties.
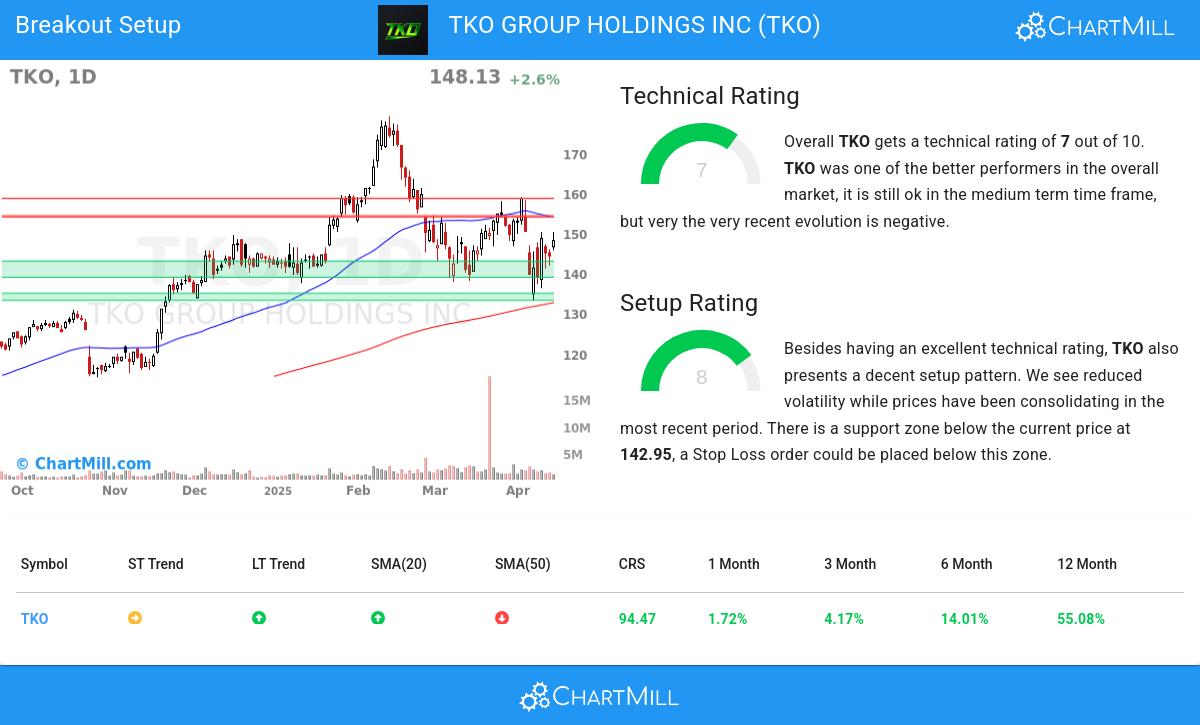
Overall TKO gets a technical rating of 7 out of 10. In the last year, TKO was one of the better performers, although we are getting mixed signals now in both the short and medium term time frames.
- The long term trend is positive and the short term trend is neutral. The long term trend gets the benefit of the doubt for now.
- When comparing the yearly performance of all stocks, we notice that TKO is one of the better performing stocks in the market, outperforming 94% of all stocks. We also observe that the gains produced by TKO over the past year are nicely spread over this period.
- TKO is one of the better performing stocks in the Entertainment industry, it outperforms 90% of 72 stocks in the same industry.
- TKO is currently trading in the middle of its 52 week range. This is in line with the S&P500 Index, which is also trading in the middle of its range.
- In the last month TKO has a been trading in the 133.07 - 159.00 range, which is quite wide. It is currently trading in the middle of this range, so some resistance may be found above.
For an up to date full technical analysis you can check the technical report of TKO
How do we evaluate the setup for TKO?
Besides the Technical Rating, ChartMill assigns a Setup Rating to every stock to determine the degree of consolidation. This rating, ranging from 0 to 10, is updated daily and evaluates various short-term technical indicators. TKO currently holds a 8 as its setup rating, suggesting a particular level of consolidation in the stock.
TKO has an excellent technical rating and also presents a decent setup pattern. We see reduced volatility while prices have been consolidating in the most recent period. There is a support zone below the current price at 142.95, a Stop Loss order could be placed below this zone.
How can TKO be traded?
For a potential trade one would typically wait until the stock breaks out of the consolidation zone to enter the stock and it could be sold again for a loss when it would fall back below the zone.
Disclaimer: This article is not intended to provide trading advice. It is crucial to conduct your own analysis and consider your own observations and trading style when making investment decisions. The article solely presents technical observations and should not be relied upon as a sole basis for trading.
Every day, new breakout setups can be found on ChartMill in our Breakout screener.
Keep in mind
This is not investing advice! The article highlights some of the observations at the time of writing, but you should always make your own analysis and invest based on your own insights.