
For investors focused on technical analysis, finding stocks that are both fundamentally sound and ready for a near-term price change is a constant goal. One systematic method involves looking for stocks that show good technical condition while also trading in a narrow range, a common sign of a possible breakout. This method relies on two specific metrics: the ChartMill Technical Rating, which measures the overall condition and direction of a stock, and the ChartMill Setup Quality Rating, which judges the condition of its current trading pattern. A stock with high scores in both areas is interesting for technical investors, as it joins a good basic direction with a clear, lower-risk chance to enter.
Technical Condition: A Good Base
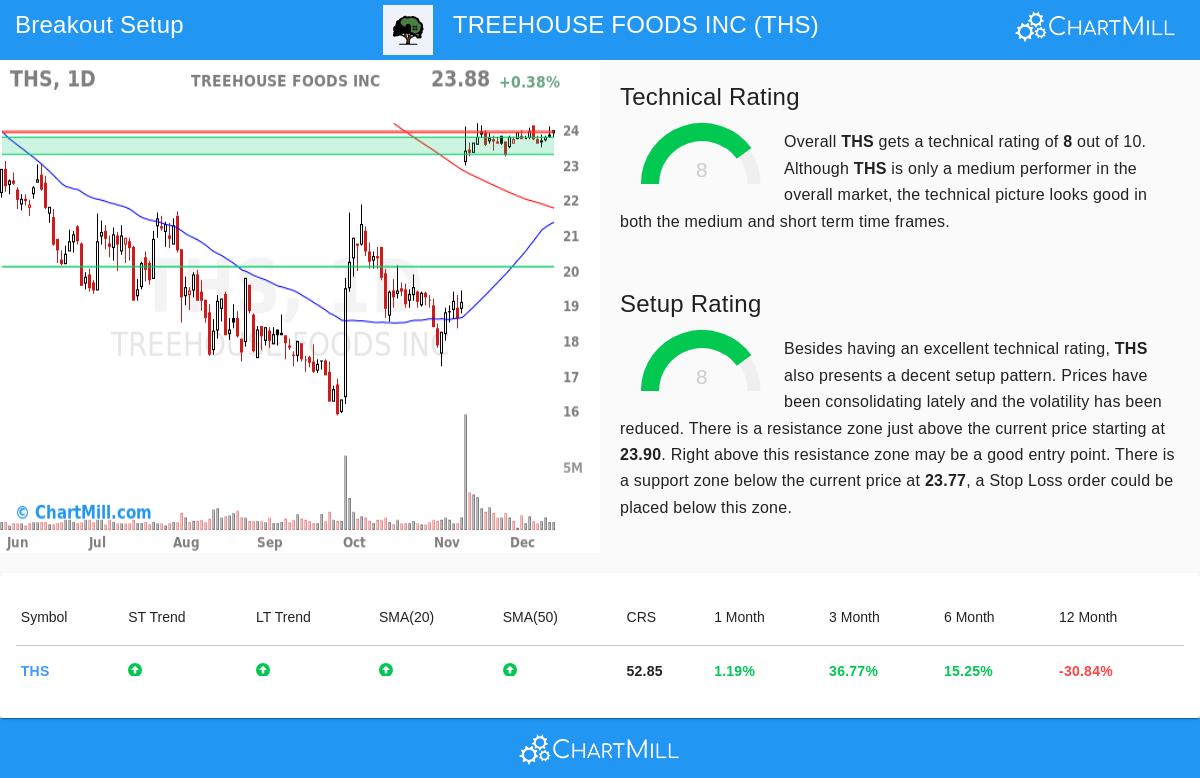
The first part of this strategy is confirming the stock is in a good upward direction, and TREEHOUSE FOODS INC (NYSE:THS) shows this clearly. According to the latest ChartMill Technical Analysis report, THS gets a Technical Rating of 8 out of 10. This number comes from a multi-part study of price movement, moving averages, and relative strength.
Key technical good points for THS include:
- Positive Direction Agreement: Both the long-term and short-term directions for the stock are rated as positive. This agreement across time periods points to continued buying interest and a smaller chance of a quick direction change.
- Good Industry Position: Inside the competitive Food Products industry, THS does better than 75% of its 86 peers. This strength compared to the sector is an important sign of leadership and durability.
- Bullish Pattern Seen: The report states that THS is currently showing a bull flag pattern. This pattern usually forms after a strong upward move and is marked by a small, downward-tilting consolidation. It is often seen as a pause before the main upward direction continues.
This good technical rating is needed for the breakout strategy because it selects for stocks with momentum. Investing in a breakout from a stock already in a confirmed upward direction raises the chance that the move will continue, instead of being a false signal in a weak or falling stock.
Setup Condition: The Trading Pattern Before the Move
A strong direction alone is not a buy signal; entering at a high price can lead to quick declines. This is where the Setup Quality Rating is key. THS scores an 8 here too, pointing to a good consolidation period. The setup score judges how narrowly a stock is trading and if it shows a clear level for entry and exit.
The current setup for THS shows several good traits:
- Specific Trading Band: Over the last month, THS has traded in a narrow band between $23.23 and $24.17. This tightening in price and changeability often comes before a notable increase, or breakout.
- Clear Support and Resistance: The analysis finds a clear support area between $23.28 and $23.77, made by a mix of moving averages and trendlines. Just above the current price, a resistance area is between $23.90 and $23.94. These specific levels allow for exact trade planning.
- Lower Volume on Decline: The report notes that volume has been much lower during the recent consolidation. This is usually seen as a positive sign, showing an absence of strong selling during the decline part of the bull flag.
For a technical investor, this high setup score means a tactical chance. The specific resistance level near $23.95 gives a concrete trigger point for a possible breakout. A move above this level on rising volume could signal the end of the consolidation and the start of the next upward phase. On the other hand, the specific support area gives a logical place to set a protective stop-loss order, clearly stating the risk of the trade if the breakout does not happen.
A Joined Technical View
When joined, the good Technical Rating and high Setup Quality Rating present THS as a stock that is both moving in a good direction and tightening for a possible move. The automated analysis suggests a possible trading plan with an entry just above the resistance at $23.95 and a stop-loss just below support near $23.49, stating a clear and measured risk limit. It is important to remember that this is an example created from the technical factors; investors should always do their own analysis and change entries, exits, and position size to match their personal risk comfort.
Finding Other Chances
The screening process that found THS can be used daily to find new possible breakout candidates across the market. For investors interested in seeing the current list of stocks meeting similar conditions of good technicals and high-condition setups, the live results are available through the Technical Breakout Setups screen.
Disclaimer: This article is for informational purposes only and does not constitute financial advice, a recommendation, or an offer or solicitation to buy or sell any securities. The analysis presented is based on technical indicators and automated reports, which are subject to interpretation and change. All investing involves risk, including the potential loss of principal. Past performance is not indicative of future results. Always conduct your own due diligence and consider consulting with a qualified financial advisor before making any investment decisions.