
Transportadora de Gas del Sur SA (NYSE:TGS) has been recognized as a potential choice for both Mark Minervini’s trend-following approach and high-growth momentum investing. The selection method blends Minervini’s strict Trend Template, a technical system for spotting stocks in strong upward trends, with a High Growth Momentum (HGM) rating to confirm the company shows fast earnings and revenue growth. This combined method helps traders and investors locate stocks with both solid price movement and strong fundamental performance.
Why TGS Matches the Minervini Trend Template
Minervini’s Trend Template demands stocks to fulfill several technical conditions to confirm a strong upward trend. Here’s how TGS measures up:
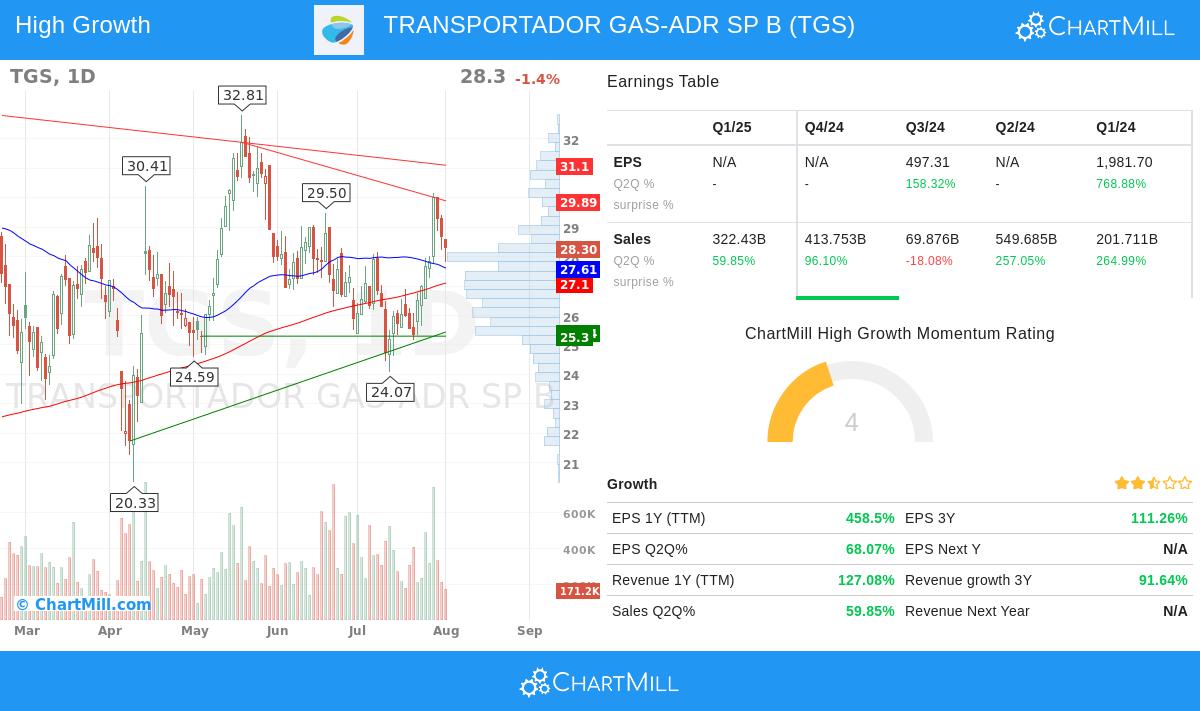
- Price Above Key Moving Averages: TGS is trading above its 50-day ($27.61), 150-day ($27.53), and 200-day ($27.10) moving averages, showing positive movement across short, medium, and long-term periods.
- Upward-Sloping Moving Averages: The 200-day MA is increasing, supporting a positive long-term trend.
- Relative Strength: With a ChartMill Relative Strength (CRS) score of 91.45, TGS performs better than 91% of all stocks, a key feature of market leaders preferred by Minervini.
- Proximity to 52-Week High: The stock is within 18% of its 52-week high ($34.37), reflecting strong movement.
These elements fit Minervini’s strategy of trading stocks in Stage 2 upward trends, where price action is strongest and risk/reward setups are most favorable.
High Growth Momentum Fundamentals
Beyond technical strength, TGS displays rapid earnings and revenue growth, a sign of high-growth momentum stocks:
- Earnings Growth:
- EPS grew 1,534.6% YoY in the last full fiscal year.
- Quarterly EPS growth rose 68.1% YoY in the most recent quarter, with earlier quarters showing even larger increases (2531% and 968.8% YoY).
- Revenue Growth:
- Revenue climbed 169.4% YoY in the last fiscal year.
- Recent quarterly sales growth was 59.8% YoY, following earlier quarters with gains of 84.5%, 243.6%, and 257.1%.
- Profit Margins: Net margins improved to 33.3% in the latest quarter, up from 20.4% two quarters prior, showing better operational efficiency.
This mix of fast earnings, strong sales growth, and wider margins suggests TGS is seeing fundamental momentum, a key factor behind continued price gains.
Technical Outlook and Trade Setup
ChartMill’s technical report gives TGS a rating of 8/10, highlighting its strong relative strength and positive short-term trend. However, the setup quality is rated 7/10, indicating some volatility that may need patience for a better entry. Key levels to watch:
- Support:
- $26.87 - $27.62 (50-day MA & trendline support)
- $25.28 - $25.44 (secondary support zone)
- Resistance:
- $29.89 - $30.15 (near-term resistance)
- $31.00 - $31.10 (next key level)
A move above $30.16 could signal more upside, while a drop below $26.86 would weaken the positive structure.
Final Thoughts
TGS offers a strong case for trend followers and growth investors. Its alignment with Minervini’s Trend Template confirms solid technical health, while its fast earnings and revenue growth support its high momentum rating. Traders should watch consolidation near resistance for a possible breakout chance.
For more high-growth momentum stocks meeting the Minervini criteria, check our High Growth Momentum + Trend Template screen.
For a more detailed technical analysis, see the full ChartMill TA report on TGS.
Disclaimer: This analysis is for informational purposes only and does not constitute investment advice. Always conduct your own research and consider risk management strategies before trading.