
For investors who use charts and price action to make decisions, a methodical process for spotting possible trades is important. One such process involves looking for stocks that are both technically sound and forming a constructive price pattern, often called a breakout setup. This method tries to find equities that are in clear uptrends but are now pausing, providing a possible entry point before the next move up. The aim is to mix momentum with timing, trying to take part in the strongest stocks at times of lower risk.
TEVA PHARMACEUTICAL-SP ADR (NYSE:TEVA) has appeared from such a screening process, presenting an interesting case for technical investors. The company, a global leader in the development and sale of generic and specialty medicines, is now showing a strong technical profile paired with a high-quality setup, indicating it may be ready for a continuation of its recent large gain.
Exceptional Technical Strength
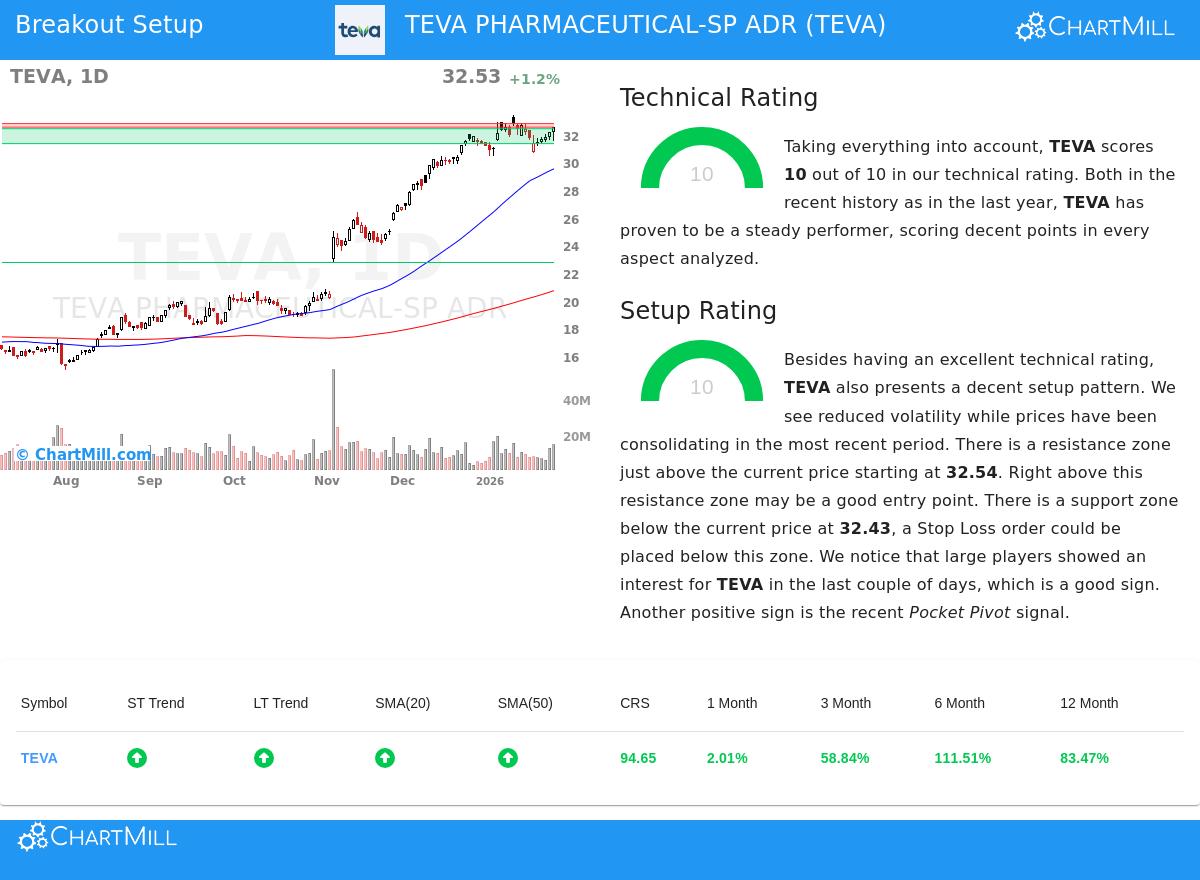
The base of a breakout strategy starts with a stock's basic technical health. A stock must show lasting momentum and strength compared to the wider market to be seen as a good candidate. TEVA's technical rating, a proprietary score from ChartMill that measures these factors, is a perfect 10 out of 10. This top rating signals outstanding technical strength and is a main filter for spotting market leaders.
A closer look at the detailed technical report shows the reasons for this score:
- Strong Trend Alignment: Both the long-term and short-term trends for TEVA are rated as positive. This alignment across timeframes shows a steady and healthy upward path, which is the main requirement for a momentum-based method.
- Dominant Relative Performance: TEVA is doing better than 94% of all stocks in the market over the past year. Even within its competitive Pharmaceuticals industry, it beats 85% of its 190 peers. This outstanding relative strength is a sign of leading stocks that often keep leading.
- Strong Moving Average Support: The stock is trading above all its key simple moving averages (20, 50, 100, and 200-day), and each of these averages is itself in a rising pattern. This layered, bullish alignment of support levels is a classic sign of a sound uptrend.
- Proximity to Highs: TEVA is trading near its 52-week high, confirming the strength of the current move. The report notes this performance is in line with the also-strong S&P 500, showing the stock is keeping up with a bullish market.
This mix of factors makes TEVA a clear example of a technically "solid" stock, which is the essential first answer to the question of which stock to think about.
A High-Quality Consolidation Setup
While a strong trend is needed, it is not enough for a best entry. Buying a stock after a sharp, extended run has the risk of an immediate pullback. So, the second important part is timing, or spotting when to buy. This is where the quality of the current price pattern, or "setup," matters. TEVA has a Setup Quality rating of 10, showing it is in a clear consolidation phase.
The setup analysis shows why this period of pause is constructive:
- Reduced Volatility and Defined Range: The stock has been trading between $30.47 and $33.42 over the past month, with the current price located in the middle of this range. This consolidation has let the stock absorb its large gains—over 111% in the last six months—and has lowered price volatility, which often comes before a new directional move.
- Clear Support and Resistance: The analysis finds a well-defined support zone between $31.35 and $32.43, made by a mix of trendlines and moving averages. Just above the current price, a resistance zone sits between $32.54 and $32.80. These clear levels give logical points for a stop-loss (below support) and a possible breakout trigger (above resistance).
- Supportive Market Activity: The report notes positive signals below the surface, including interest from large players (as measured by volume analysis) and a recent "Pocket Pivot" signal, which suggests accumulation during the consolidation. These can be early signs of institutional buying pressure.
A Possible Trading Scenario
Based on this technical and setup analysis, a specific scenario appears. The resistance zone around $32.80 becomes a logical trigger point for a breakout. A move above this level could signal the end of the consolidation and the start of the next upward phase. On the other hand, the strong support zone near $32.40 provides a clear area to define risk, with a break below suggesting the setup has not worked.
For investors using this technical breakout method, TEVA represents a rare match of top scores in both trend strength and setup quality. It shows the screen's aim: to find leading stocks that are pausing in an orderly way, possibly giving a measured-risk chance to join an established trend.
Find more possible breakout setups daily by visiting the Technical Breakout Setups screen.
,
Disclaimer: This article is for informational purposes only and is based on a technical analysis method. It does not constitute investment advice, a recommendation to buy or sell any security, or an endorsement of any particular strategy. The trading scenario described is automatically generated for illustrative purposes. Investors should do their own research, consider their individual risk tolerance, and be aware of upcoming company events like earnings reports before making any investment decisions. Past performance is not indicative of future results.