
A systematic method for finding stocks with high potential usually involves joining detailed technical study with attention to the basic business force. One well-known system that represents this combination is the strategy made famous by trader Mark Minervini. His method depends on the "Trend Template," a group of technical rules made to find stocks in strong, confirmed uptrends, and the "Specific Entry Point Analysis" (SEPA), which adds fundamental growth to identify catalysts. This system looks for not simply any advancing stock, but those showing firm price formation, better relative strength, and quickening earnings and sales, the signs of market leadership.
TECK RESOURCES LTD-CL B (NYSE:TECK) recently appeared from a screen created to locate securities that fit this two-part view, satisfying both the technical rules of the Minervini Trend Template and the fundamental energy needed for investing in fast-growth momentum. We will look at how this diversified mining company measures up against these strict rules.
Satisfying the Minervini Trend Template
The Trend Template's main goal is to sort for stocks showing clear technical strength over several time periods. It works as a quality check, confirming a candidate is in a definite Stage 2 advance, the period where the largest gains usually happen. For TECK Resources, the present technical view indicates a firm fit with these rules:
- Price Above Key Averages: The stock's last price of $47.89 trades well above its rising 50-day ($43.28), 150-day ($39.63), and 200-day ($38.72) simple moving averages (SMAs). This layered order points to continued buying interest across short, medium, and long-term views.
- Moving Average Order: The 50-day SMA is above both the 150-day and 200-day SMAs, and the 150-day SMA is above the 200-day SMA. This successive positive order confirms the trend's soundness and increasing momentum.
- Nearness to Highs: A central Minervini idea is to concentrate on strength, not weakness. TECK's price is within 25% of its 52-week high of $48.68, showing it is behaving like a market leader instead of a laggard healing from large losses. At the same time, it stays more than 30% above its 52-week low of $28.32.
- Better Relative Strength: With a ChartMill Relative Strength (CRS) score of 80, TECK does better than 80% of the wider market. High relative strength is a key filter in the Minervini system, as it finds stocks that are wanted and leading the market up, often before major indices.
This combination of technical factors shows a stock in a firm uptrend, meeting the basic checklist that Minervini uses to steer clear of speculative or damaged chart patterns.
Evaluating Fast-Growth Momentum Fundamentals
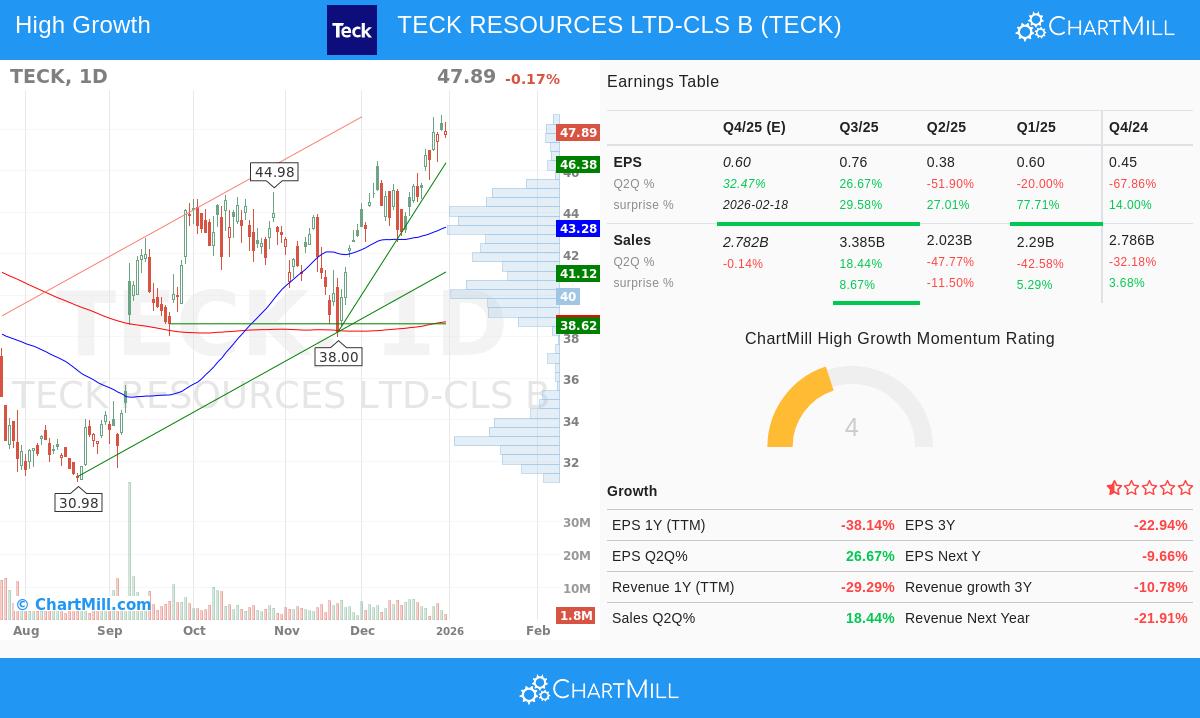
While the Trend Template confirms a sound chart, the SEPA system requires a fundamental catalyst. The "High Growth Momentum" (HGM) part of the screen looks for companies displaying clear, getting better business results that can support more price gains. TECK's recent financial numbers show several good turning points:
- Earnings Revisions & Surprises: Analyst opinion is becoming positive. The average estimate for next year's earnings has been adjusted up by over 15% in the past three months, hinting at increasing belief in future profits. Also, the company has exceeded EPS estimates in each of the past four quarters, with an average surprise of 37%.
- Quarterly Earnings Recovery: After a time of year-over-year drops, the latest quarter showed a major positive change, with EPS growth of 26.7%. Future estimates indicate a continuation of this recovery.
- Sales Growth Return: Matching the earnings change, quarterly sales growth has returned to positive ground, rising by over 18% in the last reported quarter. This is an important sign of basic demand and pricing ability for its commodity mix.
- Firm Profitability: Despite cycle pressures, the company keeps profitability, with a net margin of 8.3% in the last quarter. Improving sales on a steady margin base can lead to increased earnings growth.
These parts are key for the fast-growth momentum investor because they give the "reason" behind the price move. Quickening fundamentals, positive estimate changes, and steady earnings beats are the catalysts that draw institutional buying and can maintain a strong trend.
Technical Condition and Setup Points
According to ChartMill's own analysis, TECK gets a firm Technical Rating of 8 out of 10, showing its positive long-term and short-term trends and its place near 52-week highs. The report notes the stock is trading in a wide monthly range but is presently near the top of that range, indicating strength.
However, the analysis also gives a note of care for immediate entry: the Setup Quality rating is a medium 4. The report says that "price movement has been a little bit too volatile to find a nice entry and exit point," suggesting the stock may be stretched in the very short term and might gain from a time of consolidation or a retreat to a set support level before giving a lower-risk entry chance. This difference is important, a stock can be technically very good but need patience for a best setup.
For a full breakdown of support and resistance levels, moving average orders, and volume analysis, you can see the complete Technical Analysis Report for TECK.
Conclusion
TECK RESOURCES LTD-CL B presents a strong example of a stock that meets a strict, multi-factor screen. It shows the technical signs of a Minervini-style trend leader, with price action holding above key moving averages and displaying firm relative performance. Fundamentally, it shows key momentum traits with a noticeable recovery in quarterly earnings and sales, joined with climbing analyst estimates.
This mix hints the recent price trend may be supported by getting better business fundamentals, a link that growth-focused trend followers look for. As with any system, discipline about entry and risk control stays very important. The present technical setup hints investors might want to look for a more formed volatility pattern or a retreat toward support to better the possible risk/reward balance.
Interested in locating other stocks that meet similar rules for firm trends and growth momentum? You can examine the preset screen using this link: High Growth Momentum + Trend Template Screen.
Disclaimer: This article is for informational and educational purposes only. It is not intended as investment advice, a recommendation, or an offer to buy or sell any security. The analysis is based on data provided and certain screening methodologies; past performance is not indicative of future results. Always conduct your own due diligence and consider consulting with a qualified financial advisor before making any investment decisions.