
Peter Lynch's investment method focuses on finding reasonably priced companies with lasting growth paths. His system mixes parts of value and growth investing, concentrating on businesses with sound basics that can be owned for long stretches. The method highlights earnings growth inside a 15-30% span to prevent unstable expansion, paired with careful debt amounts and strong profit measures. This structure helps investors find companies selling at appealing prices compared to their growth outlook.
Meeting Lynch's Growth Standards
TRIP.COM GROUP LTD-ADR (NASDAQ:TCOM) shows the managed growth Lynch liked. The company's five-year EPS growth of 21.05% sits directly inside Lynch's chosen 15-30% span, showing lasting enlargement without the instability of very fast growth. This steady growth path implies the company can continue its pace without straining its activities or assets. Lynch specifically stayed away from companies growing too fast, thinking constant, foreseeable enlargement built more dependable long-haul gains.
Valuation Review
The company's PEG ratio of 0.87 is notable as especially interesting under Lynch's system. Lynch viewed PEG ratios under 1.0 as a sign of underpriced growth chances, as they imply the market has not completely valued the company's growth outlook. This measure merges the P/E ratio with earnings growth, giving a more detailed look at price than P/E by itself. For investors looking for growth at sensible prices, this ratio implies TCOM provides growth possibility without overly high price tags.
Financial Condition and Earnings
The company's financial numbers match well with Lynch's focus on solid balance sheets and operational effectiveness:
- Debt/Equity ratio of 0.07 is much better than Lynch's chosen limit of 0.25
- Current ratio of 1.48 shows good short-term cash health
- Return on Equity of 18.53% is above Lynch's 15% minimum need
These numbers show the cautious financial management Lynch appreciated, lowering danger while keeping sound operational results. The small debt level gives room to maneuver during economic slowdowns, while the high ROE shows productive use of investor money.
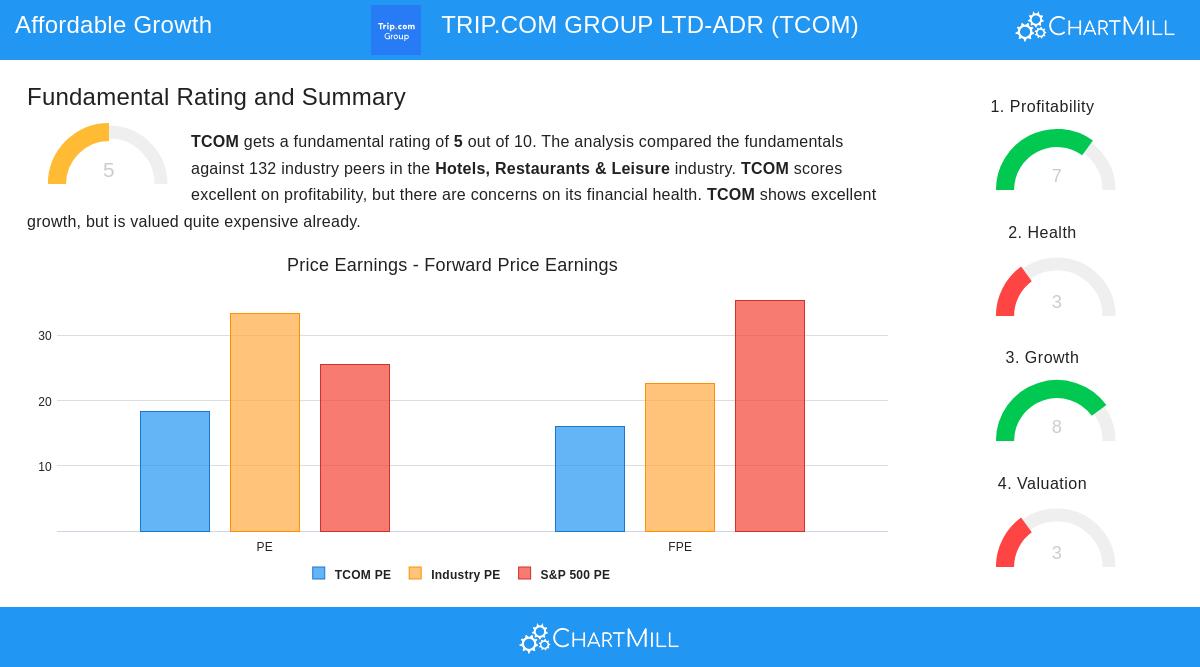
Fundamental Analysis Summary
The full fundamental analysis report shows a varied but mostly good view. TCOM displays very good profit measures, with profit margins and operating margins placed near the best in its field. The company shows solid revenue and earnings growth both in the past and in future estimates. Still, questions remain about financial condition, especially regarding value made compared to capital expenses. Pricing looks fair compared to industry competitors, although some measures indicate higher-than-average costs.
Industry Standing and View
As a worldwide travel service, TCOM works in a field that gains from long-range growth patterns in global travel and digital change. The company's combined method for travel services places it to gain several income sources within the travel network. While the travel business deals with recurring difficulties, the company's size and platform setup supply competitive benefits that fit with Lynch's liking for businesses with clear, actual operations.
For investors wanting to look at other companies that fit Peter Lynch's investment standards, more screening outcomes can be found using our Peter Lynch Strategy Screener.
Disclaimer: This analysis is for informational purposes only and does not constitute investment advice, recommendation, or endorsement of any security. Investors should conduct their own research and consult with financial advisors before making investment decisions.