
TRIP.COM GROUP LTD-ADR (NASDAQ:TCOM) has caught the eye of our stock screener as an affordable growth stock. TCOM is displaying robust growth metrics and also excels in terms of profitability, solvency, and liquidity. Additionally, it appears to be reasonably priced. Let's delve into the details.
Looking at the Growth
A key component of ChartMill's stock assessment is the Growth Rating, which spans from 0 to 10. This rating evaluates diverse growth factors, such as EPS and revenue growth, considering both past performance and future projections. TCOM has received a 8 out of 10:
- The Earnings Per Share has grown by an impressive 44.94% over the past year.
- TCOM shows a strong growth in Earnings Per Share. Measured over the last years, the EPS has been growing by 21.52% yearly.
- The Revenue has grown by 19.73% in the past year. This is quite good.
- TCOM shows quite a strong growth in Revenue. Measured over the last years, the Revenue has been growing by 8.36% yearly.
- The Earnings Per Share is expected to grow by 15.40% on average over the next years. This is quite good.
- The Revenue is expected to grow by 12.41% on average over the next years. This is quite good.
- When comparing the Revenue growth rate of the last years to the growth rate of the upcoming years, we see that the growth is accelerating.
A Closer Look at Valuation for TCOM
To assess a stock's valuation, ChartMill utilizes a Valuation Rating on a scale of 0 to 10. This comprehensive assessment considers various valuation aspects, comparing price to earnings and cash flows, while factoring in profitability and growth. TCOM has achieved a 5 out of 10:
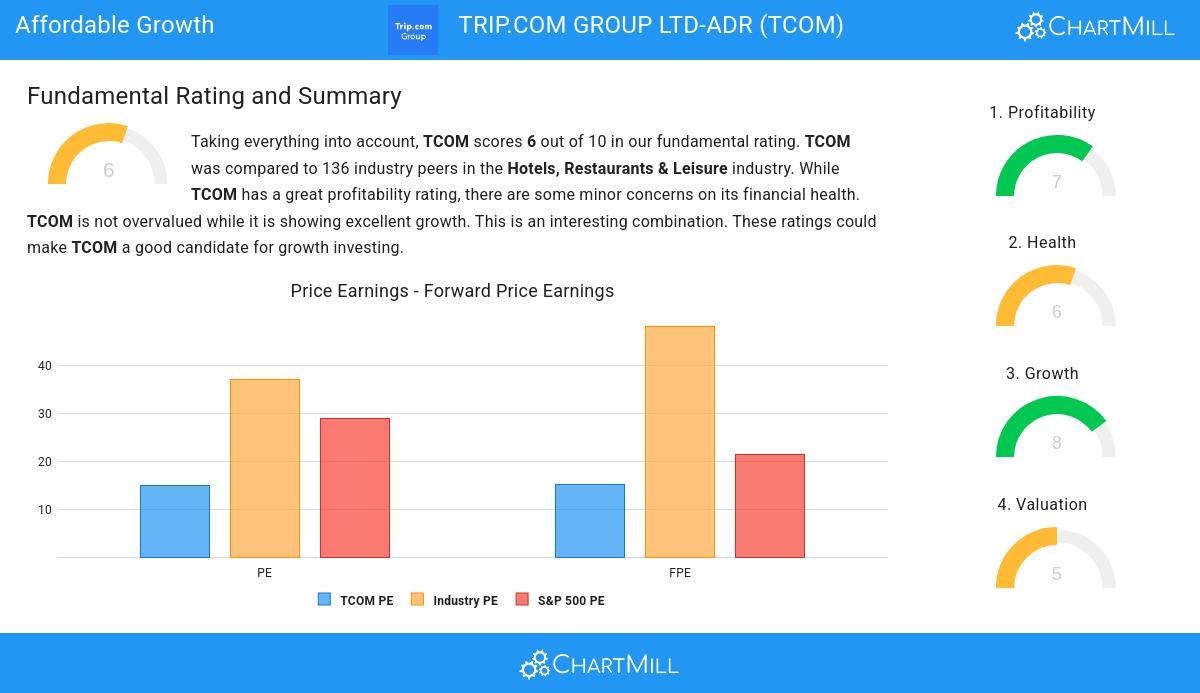
- Compared to the rest of the industry, the Price/Earnings ratio of TCOM indicates a somewhat cheap valuation: TCOM is cheaper than 77.21% of the companies listed in the same industry.
- TCOM's Price/Earnings ratio indicates a valuation a bit cheaper than the S&P500 average which is at 28.87.
- TCOM's Price/Forward Earnings ratio is a bit cheaper when compared to the industry. TCOM is cheaper than 75.00% of the companies in the same industry.
- TCOM's Price/Forward Earnings ratio indicates a valuation a bit cheaper than the S&P500 average which is at 21.38.
- TCOM's Price/Free Cash Flow ratio is rather cheap when compared to the industry. TCOM is cheaper than 81.62% of the companies in the same industry.
- The decent profitability rating of TCOM may justify a higher PE ratio.
Health Insights: TCOM
ChartMill utilizes a Health Rating to assess stocks, scoring them on a scale of 0 to 10. This rating takes into account a variety of liquidity and solvency ratios, both in absolute terms and in comparison to industry peers. TCOM has earned a 6 out of 10:
- Looking at the Altman-Z score, with a value of 2.55, TCOM is in the better half of the industry, outperforming 74.26% of the companies in the same industry.
- TCOM has a debt to FCF ratio of 2.08. This is a good value and a sign of high solvency as TCOM would need 2.08 years to pay back of all of its debts.
- Looking at the Debt to FCF ratio, with a value of 2.08, TCOM belongs to the top of the industry, outperforming 86.03% of the companies in the same industry.
- TCOM has a Debt/Equity ratio of 0.24. This is a healthy value indicating a solid balance between debt and equity.
- TCOM's Debt to Equity ratio of 0.24 is fine compared to the rest of the industry. TCOM outperforms 77.94% of its industry peers.
- With a decent Current ratio value of 1.51, TCOM is doing good in the industry, outperforming 72.06% of the companies in the same industry.
- Looking at the Quick ratio, with a value of 1.51, TCOM is in the better half of the industry, outperforming 75.00% of the companies in the same industry.
Assessing Profitability for TCOM
ChartMill's Profitability Rating offers a unique perspective on stock analysis, providing scores from 0 to 10. These ratings consider a wide range of profitability metrics and margins, both in comparison to industry peers and on their own merits. For TCOM, the assigned 7 is a significant indicator of profitability:
- With a decent Return On Assets value of 7.04%, TCOM is doing good in the industry, outperforming 77.21% of the companies in the same industry.
- The Return On Equity of TCOM (11.97%) is better than 72.06% of its industry peers.
- The 3 year average ROIC (4.09%) for TCOM is below the current ROIC(6.54%), indicating increased profibility in the last year.
- TCOM's Profit Margin of 32.03% is amongst the best of the industry. TCOM outperforms 100.00% of its industry peers.
- In the last couple of years the Profit Margin of TCOM has grown nicely.
- TCOM has a better Operating Margin (26.60%) than 91.91% of its industry peers.
- In the last couple of years the Operating Margin of TCOM has grown nicely.
- TCOM's Gross Margin of 81.25% is amongst the best of the industry. TCOM outperforms 96.32% of its industry peers.
Every day, new Affordable Growth stocks can be found on ChartMill in our Affordable Growth screener.
Check the latest full fundamental report of TCOM for a complete fundamental analysis.
Keep in mind
Important Note: The content of this article is not intended as trading advice. It is essential to perform your own analysis and exercise caution when making trading decisions. The article presents observations created by automated analysis but does not guarantee any trading or investment outcomes. Always trade responsibly and make independent judgments.