
Investors looking to find companies with both good business momentum and positive price movement often use a mix of technical and fundamental analysis. One way to do this is to look for stocks showing good growth traits, firm financial standing, and acceptable earnings, while also showing technical breakout signs. This process tries to locate securities where better fundamentals may be meeting positive market feeling, possibly pointing to a continued rise. A recent scan using this process has pointed to Tactile Systems Technology Inc (NASDAQ:TCMD) as a stock for more review.
A Good Growth Profile
This process looks for companies showing important and lasting expansion. Based on the fundamental analysis report, TCMD shows a positive growth story. The company’s Growth Rating of 7 out of 10 is backed by both past results and future outlook.
- Revenue Growth: TCMD has shown steady top-line growth, with revenue increasing 9.28% over the last year and at a yearly rate of 9.11% over several years. Analysts think this will keep going, with future revenue expected to grow almost 9% each year.
- Earnings Speed-Up: Maybe more key, the company’s earnings growth is speeding up. While past EPS growth has been moderate, future EPS is expected to rise by about 20.9% per year. This speed-up is a main quality for a growth stock, showing the company is entering a more profitable stage.
- Market Place: As a maker of medical devices for chronic diseases like lymphedema and chronic venous insufficiency, TCMD works in a specific healthcare area with a clear, unmet patient group, a good quality point for lasting growth.
Financial Health and Earnings Foundation
Good growth is most useful when backed by a stable financial base. This is why the scan includes checks for financial health and earnings, to steer clear of companies growing in an unstable way. TCMD’s fundamentals here are particularly firm.
- Very Good Financial Health: The company gets a high Health Rating of 8. Its balance sheet is a strong point, with no debt, a current ratio of 3.61, and a quick ratio of 3.20. This shows enough cash to run the business and fund growth without trouble. An Altman-Z score of 9.68 further shows a very small chance of near-term bankruptcy.
- Getting Better Earnings: With an Earnings Rating of 6, TCMD shows it is turning growth into profit. Key margins are getting stronger:
- An operating margin of 7.39% is better than nearly three-quarters of similar companies and has shown good growth lately.
- Its return on invested capital (ROIC) of 7.56% is with the best in its field, pointing to good use of money.
Technical Breakout Pattern
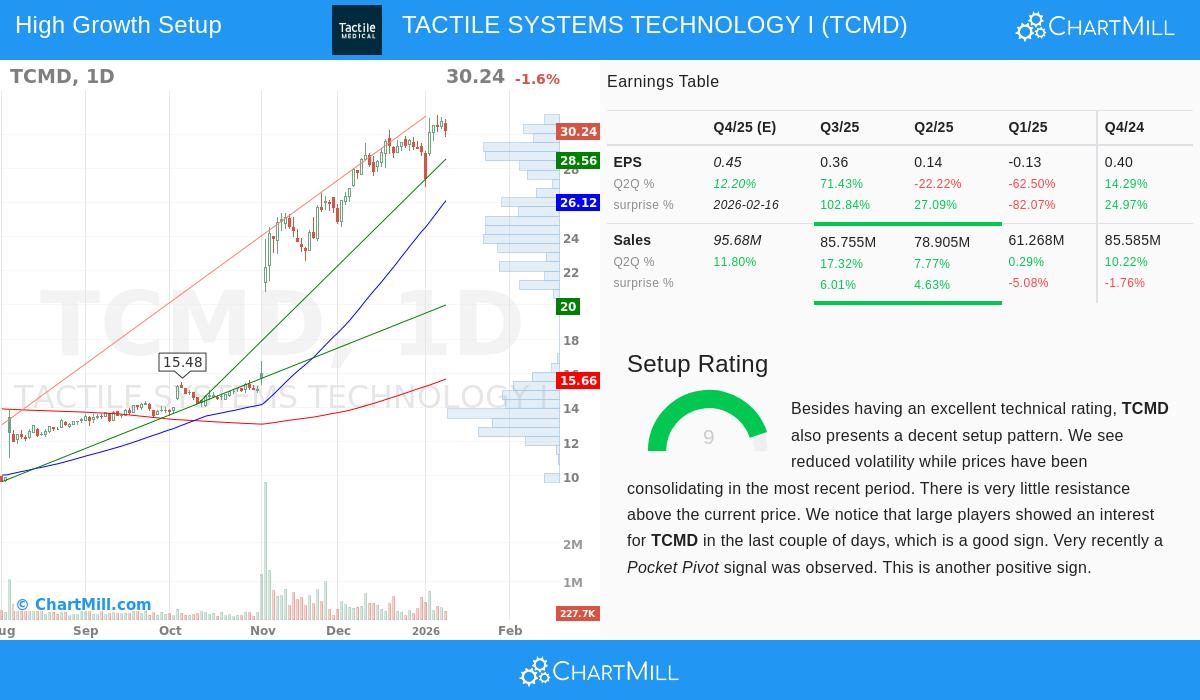
The fundamental story is given setting by the price movement. A stock with firm fundamentals can stay quiet for long times; the technical analysis tries to find when market view is matching the fundamental facts. TCMD’s technical analysis report gives a top rating of 9, noting a strong and steady trend.
- Clear Trend: Both the short and long-term trends are positive, with the stock price well above its main moving averages (20, 50, 100, and 200-day SMAs), all of which are going up.
- Relative Performance: TCMD is a top performer in its sector, doing better than 96% of its 185 peers in the Health Care Equipment & Supplies field. It is now trading near its 52-week high, a sign of continued momentum.
- Pause and Breakout Chance: The report states that prices have been pausing in a zone between about $27 and $31 over the last month, with recent price swings getting smaller, a setup that often comes before a new price move. With almost no price barriers above noted, a clear move above the recent zone high could be seen as a technical breakout, confirming the existing strength.
Valuation Setting
Growth stocks often have high valuations, and TCMD is similar. Its Valuation Rating is a middle 4. While its P/E ratio of 39 seems high next to the wider S&P 500, it is actually lower priced than over 70% of similar companies. This field-relative price, mixed with its speeding earnings growth rate, suggests the market may be valuing its future chance rather than only its current results. The high expected growth rate is a key point that can support a higher earnings multiple for growth-focused investors.
Why This Mix Is Important
The mix of these points is what makes the scan process strong. TCMD is not only a stock with positive technicals; its rise is supported by speeding earnings outlook, a very firm debt-free balance sheet, and getting better earnings. On the other hand, its firm fundamentals are being seen and followed by the market, as shown by its strong uptrend and sector-leading relative performance. This meeting tries to sort for chances where fundamental gain and positive price momentum are supporting each other.
For investors wanting to look at other stocks that fit this specific mix of good growth, financial steadiness, and positive technical setups, more results can be seen by checking the Strong Growth Stock Technical Setups screen.
Disclaimer: This article is for information only and is not financial advice, a suggestion, or an offer or request to buy or sell any securities. The review is based on data and reports from ChartMill.com as of the date written. Investing has risk, including the possible loss of money. Always do your own separate research and think about your personal money situation and risk comfort before making any investment choices.