
Our stock screener has spotted TARSUS PHARMACEUTICALS INC (NASDAQ:TARS) as a stocks which checks several boxes as specified by Mark Minervini. We will dive into an analysis below.
A Technical Analysis using the Minervini Trend Template.
The Minervini Trend Template is a set of technical criteria designed to identify stocks in strong uptrends. We can check all the boxes for TARS:
- ✔ Relative Strength is above 70.
- ✔ Current price is within 25% of it's 52-week high.
- ✔ Current price is at least 30% above it's 52-week low.
- ✔ The current price is above the 50-, 150- and 200-day SMA price line.
- ✔ The SMA(200) is trending upwards.
- ✔ The SMA(150) is above the SMA(200)
- ✔ The SMA(50) is above the SMA(150) and the SMA(200)
ChartMill's Evaluation of Growth
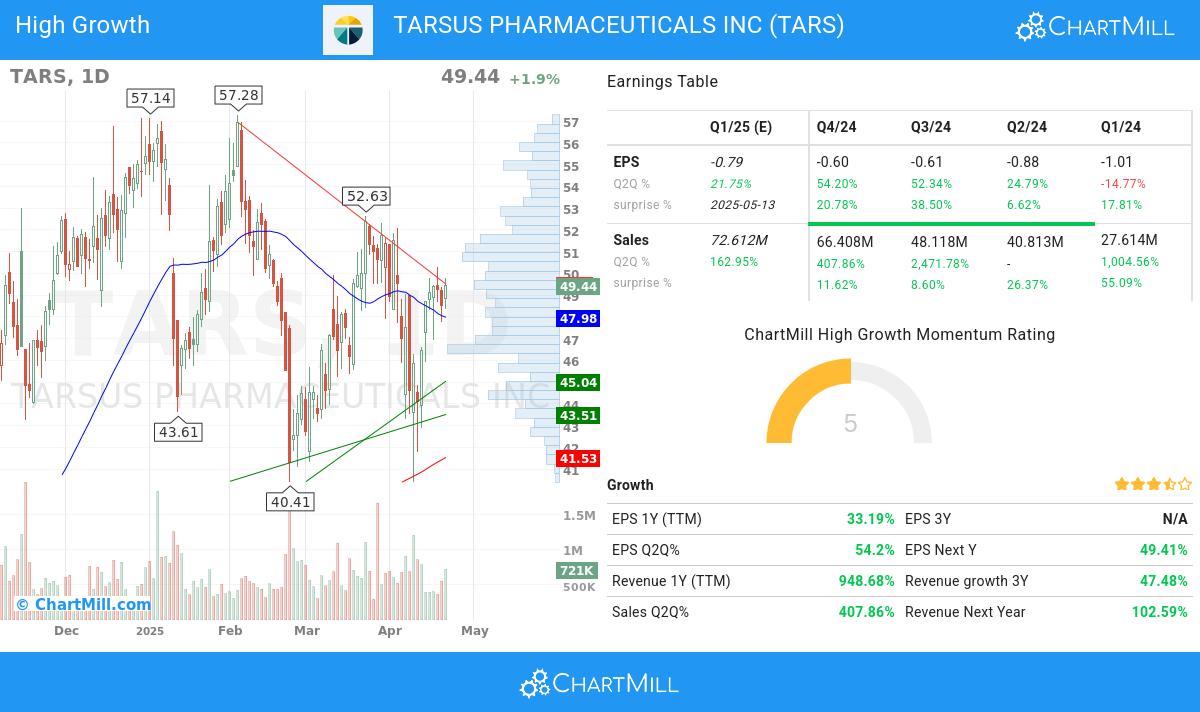
ChartMill assigns a High Growth Momentum Rating (HGM) to each stock, ranging from 0 to 10. This rating is determined by analyzing different growth and profitability elements, including EPS and revenue growth, accelleration, surprises and revisions. In the case of TARS, the assigned 5 reflects its growth potential:
Earnings Momentum
- TARS has demonstrated consistent growth in its earnings per share (EPS) from one quarter to another (Q2Q), with a 54.2% increase. This indicates improving financial performance and the company's effective management of its operations.
- TARS shows accelerating EPS growth: when comparing the current Q2Q growth of 54.2% to the previous quarter Q2Q growth of 52.34%, we see the growth rate improving.
- EPS growth accelerated for 3 quarters in a row.
- The 1-year EPS growth of TARS (33.19%) highlights the company's ability to consistently improve its earnings performance and suggests a positive outlook for future profitability.
- The quarter-to-quarter (Q2Q) revenue growth of 408.0% of TARS has been strong, reflecting the company's ability to generate consistent sales growth. This growth suggests the company's ability to meet customer needs and drive revenue growth.
- The 1-year revenue growth of TARS (949.0%) has been strong, reflecting the company's ability to generate consistent sales growth. This growth suggests the company's ability to meet customer needs and expand its market share.
- With a track record of beating EPS estimates in the last 4 quarters, TARS showcases its consistent ability to deliver earnings surprises. This reflects the company's strong execution and its competitive position in the market.
Financial Strength & Profitability
- With positive growth in its operating margin over the past year, TARS showcases its ability to improve profitability through effective cost control and operational efficiency. This growth underscores the company's commitment to enhancing its financial performance.
- With positive growth in its free cash flow (FCF) over the past year, TARS showcases its ability to generate strong cash flows and maintain a solid financial position. This growth reflects the company's efficient utilization of capital and its commitment to long-term value creation.
- With a Debt/Equity ratio of 0.32, TARS maintains a solid financial position with controlled leverage.
Strong Market Performance
- The Relative Strength (RS) of TARS has consistently been strong, with a current 94.25 rating. This indicates the stock's ability to exhibit relative price outperformance and reflects its competitive strength.
Why is TARS a setup?
ChartMill provides a Setup Rating for each stock. This rating, ranging from 0 to 10, assesses the level of consolidation in the stock based on multiple short-term technical indicators. Currently, TARS has a 7 as its setup rating, indicating its current consolidation status.
TARS has only a medium technical rating, but it does show a decent setup pattern. We see reduced volatility while prices have been consolidating in the most recent period. There is very little resistance above the current price. There is a support zone below the current price at 48.80, a Stop Loss order could be placed below this zone.
For an up to date full technical analysis you can check the technical report of TARS
Final Thoughts
Our High Growth Momentum + Trend Template screen will find you more ideas which meet the Minervini criteria.
Disclaimer
This article should in no way be interpreted as advice. The article is based on the observed metrics at the time of writing, but you should always make your own analysis and trade or invest at your own responsibility.