
Our stock screener has spotted TARSUS PHARMACEUTICALS INC (NASDAQ:TARS) as a stocks which checks several boxes as specified by Mark Minervini. We will dive into an analysis below.
Does TARS pass the Minervini Trend Template check?
The Minervini Trend Template is a set of technical criteria designed to identify stocks in strong uptrends. We can check all the boxes for TARS:
- ✔ Relative Strength is above 70.
- ✔ Current price is within 25% of it's 52-week high.
- ✔ Current price is at least 30% above it's 52-week low.
- ✔ The current price is above the 50-, 150- and 200-day SMA price line.
- ✔ The SMA(200) is trending upwards.
- ✔ The SMA(150) is above the SMA(200)
- ✔ The SMA(50) is above the SMA(150) and the SMA(200)
Assessing Growth for TARS
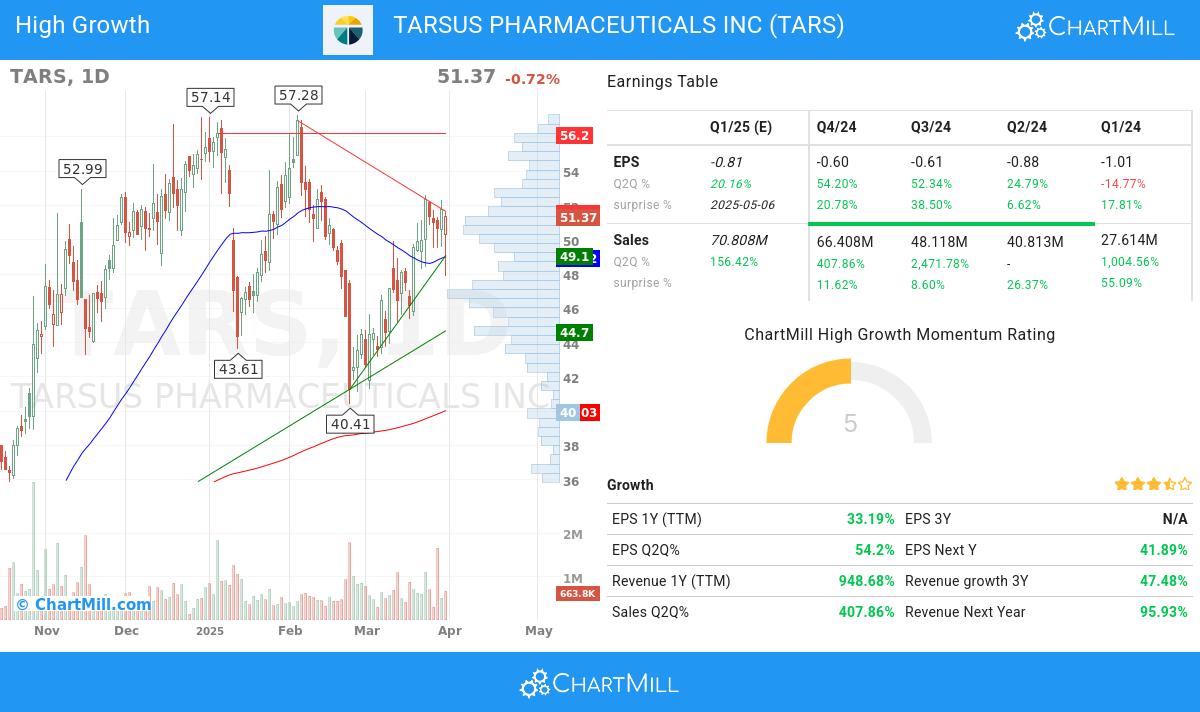
Every stock receives a High Growth Momentum Rating (HGM) from ChartMill, ranging from 0 to 10. This rating assesses various growth and profitability aspects, including historical and projected EPS and revenue growth. TARS boasts a 5 out of 10:
Explosive Earnings Growth
- In the most recent financial report, TARS reported a 54.2% increase in quarterly earnings compared to the previous quarter. This notable growth indicates positive momentum in the company's financials, suggesting an upward trend
- TARS shows accelerating EPS growth: when comparing the current Q2Q growth of 54.2% to the previous quarter Q2Q growth of 52.34%, we see the growth rate improving.
- EPS acceleration happened 3 quarters in a row.
- TARS has experienced 33.19% growth in EPS over a 12 month period, demonstrating its ability to generate sustained and positive earnings momentum.
- TARS has experienced 408.0% q2q revenue growth, indicating a significant sales increase.
- TARS has demonstrated strong 1-year revenue growth of 949.0%, reflecting revenue momentum and its ability to generate consistent top-line expansion. This growth underscores the company's strong market position and its potential for future success.
- TARS has consistently exceeded EPS estimates in the last 4 quarters, demonstrating its ability to outperform market expectations. This trend highlights the company's strong financial performance and its potential for future growth.
Profitability & Financial Strength
- TARS has experienced notable growth in its operating margin over the past year, reflecting improved operational performance. This growth suggests the company's ability to generate higher profits from its core business activities.
- TARS has shown positive growth in its free cash flow (FCF) over the past year, indicating improved cash generation and financial strength. This growth highlights the company's ability to effectively manage its cash flows and generate surplus funds.
- With a Debt-to-Equity ratio at 0.32, TARS showcases its prudent financial management. The company's balanced approach between debt and equity reflects its commitment to maintaining a stable capital structure.
Strong Market Performance
- TARS has maintained a healthy Relative Strength (RS) over the analyzed period, with a current 91.01 rating. This demonstrates the stock's ability to outperform its peers and indicates its competitive positioning.
Why is TARS a setup?
ChartMill also assign a Setup Rating to every stock. With this score it is determined to what extend the stock has been trading in a range in the recent days and weeks. This score also ranges from 0 to 10 and is updated daily. The setup score evaluates various short term technical indicators. TARS scores a 6 out of 10:
Besides having an excellent technical rating, TARS also presents a decent setup pattern. Prices have been consolidating lately. There is very little resistance above the current price. There is a support zone below the current price at 49.43, a Stop Loss order could be placed below this zone.
For an up to date full technical analysis you can check the technical report of TARS
Concluding
It looks like TARSUS PHARMACEUTICALS INC meets the Minervini criteria. More high growth momentum breakout stocks can be found in our High Growth Momentum + Trend Template screen.
Keep in mind
Important Note: The content of this article is not intended as trading advice. It is essential to perform your own analysis and exercise caution when making trading decisions. The article presents observations created by automated analysis but does not guarantee any trading or investment outcomes. Always trade responsibly and make independent judgments.