
Technical analysis gives investors tools to find possible trading chances by studying price patterns and market trends. One method becoming popular with technical traders uses screening for stocks showing both good basic technical condition and hopeful consolidation patterns, which can point to possible breakouts. This method uses ChartMill's own Technical Rating, which reviews a stock's total trend strength and momentum, with its Setup Quality Rating that finds good entry points by studying consolidation. Stocks with high marks in both groups often show good risk-reward situations for breakout traders.
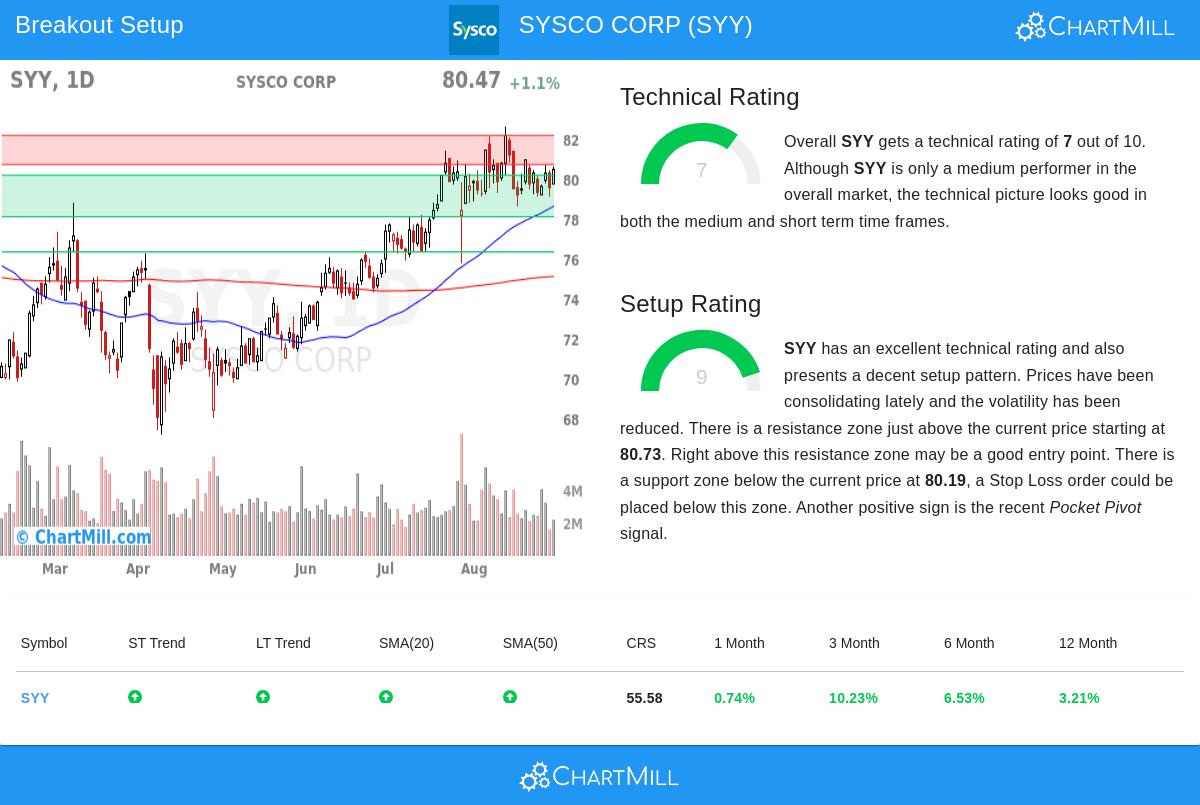
SYSCO CORP (NYSE:SYY) shows interesting features for technical investors looking for breakout possibilities. The food distribution company now has a Technical Rating of 7, pointing to good intermediate-term condition. This rating shows several good points covered in the technical analysis report, including confirmed positive trends in both short and long-term periods. The stock trades above all main moving averages, 20-day, 50-day, 100-day, and 200-day, with each average moving up, confirming continued buying interest. These technical bases are important for breakout plans because they show the stock has basic momentum that might push prices up after consolidation ends.
The Setup Quality Rating of 9 shows even more hopeful features for possible breakout traders. This very high mark means SYY has been trading in a narrow consolidation range between $78.60 and $82.64 over the last month, making a clear base pattern. Lower volatility during this time suggests balance between buyers and sellers, often coming before big price moves. The setup finds clear support near $80.19 and resistance around $80.73-$82.19, giving specific risk limits. Lately, the stock showed a Pocket Pivot signal, a volume pattern where price goes up on higher volume than the highest down volume in the last ten days. This often points to big buyer activity and makes the breakout chance stronger.
Several points make this setup especially interesting for technical traders. The nearness to resistance, trading at $80.47 against resistance starting at $80.73, means the stock needs only a small upward move to set off breakout entry signals. The specific support levels allow for exact stop-loss placement, making a good risk-reward balance. With the S&P 500 showing positive trends in both short and long-term periods, SYY works within a good larger market setting. The stock's average daily volume over 3 million shares gives enough liquidity for entry and exit.
For investors wanting to look into similar technical breakout chances, more choices can be found using the Technical Breakout Setups screen, which often finds stocks meeting these specific technical rules.
Disclaimer: This analysis is for informational purposes only and does not constitute investment advice, recommendation, or endorsement of any security. Trading involves risk of loss, and past performance does not guarantee future results. Always conduct your own research and consider consulting with a qualified financial professional before making investment decisions.