
The Caviar Cruise investment strategy represents a systematic way to find good companies suitable for long-term investment. This method, influenced by Belgian author Luc Kroeze's writing, concentrates on businesses that show steady revenue and profit increases, high returns on invested capital, acceptable debt levels, and good cash flow conversion. Instead of looking for bargain opportunities, investors using this method favor companies with lasting competitive strengths and superior operations, acknowledging that excellent businesses often have higher valuations.
Sterling Infrastructure Inc (NASDAQ:STRL) appears as a strong candidate using this screening method, showing several traits that match quality investing ideas.
Growth and Profitability Measurements
The Caviar Cruise strategy highlights both revenue and EBIT growth as signs of a company's growing operational size and better efficiency. Sterling Infrastructure displays very good performance in these areas, especially in profit creation.
• EBIT Growth (5Y CAGR): 44.55% - greatly above the 5% minimum requirement • Profit Margin: 13.33% - doing better than 90.91% of construction industry companies • Operating Margin: 14.66% - exceeding 94.55% of industry rivals • Expected Future Revenue Growth: 11.23% per year - showing potential for ongoing growth
These numbers point to not only good past performance but also solid future potential, an important mix for quality investors looking for lasting business models.
Return on Invested Capital and Effectiveness
ROIC is a fundamental part of the Caviar Cruise method, showing how well management uses capital to create returns. Sterling Infrastructure's results here are especially notable.
• ROIC (Excluding Cash, Goodwill and Intangibles): 449.63% - a very high return number • Current ROIC: 17.29% - performing better than 81.82% of industry companies • Improving ROIC Trend: Current number is higher than the 3-year average of 13.99%
The company's capacity to create large returns on invested capital indicates a good competitive position and operational effectiveness, both signs of quality businesses that can build value over long periods.
Financial Condition and Cash Flow Strength
The Caviar Cruise screen favors companies with sound balance sheets and high-quality earnings, shown by cash flow conversion and debt management measurements.
• Debt-to-Free Cash Flow: 0.68 - showing the company could pay off all debt in less than one year with current FCF • Profit Quality (5-year average): 200.18% - greatly above the 75% minimum requirement • Altman-Z Score: 6.90 - indicating minimal bankruptcy risk and financial soundness • Debt-to-Equity Ratio: 0.32 - showing careful use of leverage
These measurements show a company creating significant free cash flow compared to earnings while keeping a careful capital structure, lowering risk for long-term investors.
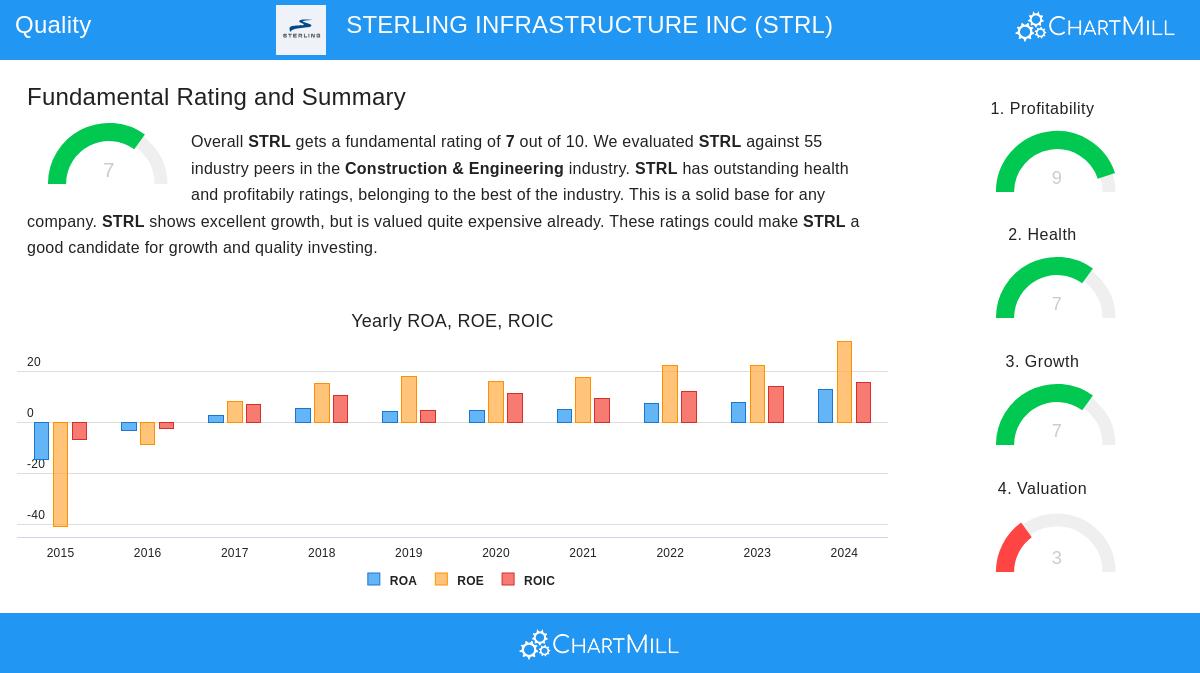
Fundamental Analysis Summary
Sterling Infrastructure's complete fundamental analysis report gives the company a good 7 out of 10 score, with especially good results in profitability (9/10) and financial condition (7/10). The company shows very good performance in the Construction & Engineering industry, with excellent margins and returns that are some of the best in the sector. While the valuation seems high with a P/E ratio of 36.17, this higher price might be reasonable given the company's very good growth outlook and operational superiority. The full fundamental analysis offers more detail on these measurements and their industry setting.
Quality Investment Points
Beyond the number-based filters, Sterling Infrastructure shows several non-number traits that quality investors usually look for. The company gains from several long-term growth patterns, including infrastructure development, data center growth, and residential building. Its geographic spread across Southern, Northeastern, Mid-Atlantic, and Rocky Mountain areas provides revenue steadiness. The business model, while focused, stays clear to investors, and the company's good margin profile indicates some level of pricing ability in its specific markets.
For investors wanting to look at more companies that fit the Caviar Cruise requirements, the complete screen results offer a wider group of potential quality investments meeting these strict standards.
Disclaimer: This analysis is for informational purposes only and does not constitute investment advice, recommendation, or endorsement of any security. Investors should conduct their own research and consult with financial advisors before making investment decisions. Past performance does not guarantee future results.