
Technical analysis often relies on identifying stocks with strong underlying momentum that are simultaneously forming consolidation patterns, offering favorable risk-reward entry points. One systematic approach involves screening for securities that exhibit both good technical health and high-quality setup patterns, as these conditions frequently precede meaningful breakouts. Scorpio Tankers Inc (NYSE:STNG) recently surfaced through such a screening methodology, displaying characteristics that may appeal to technically-oriented investors.
Technical Strength and Momentum Characteristics
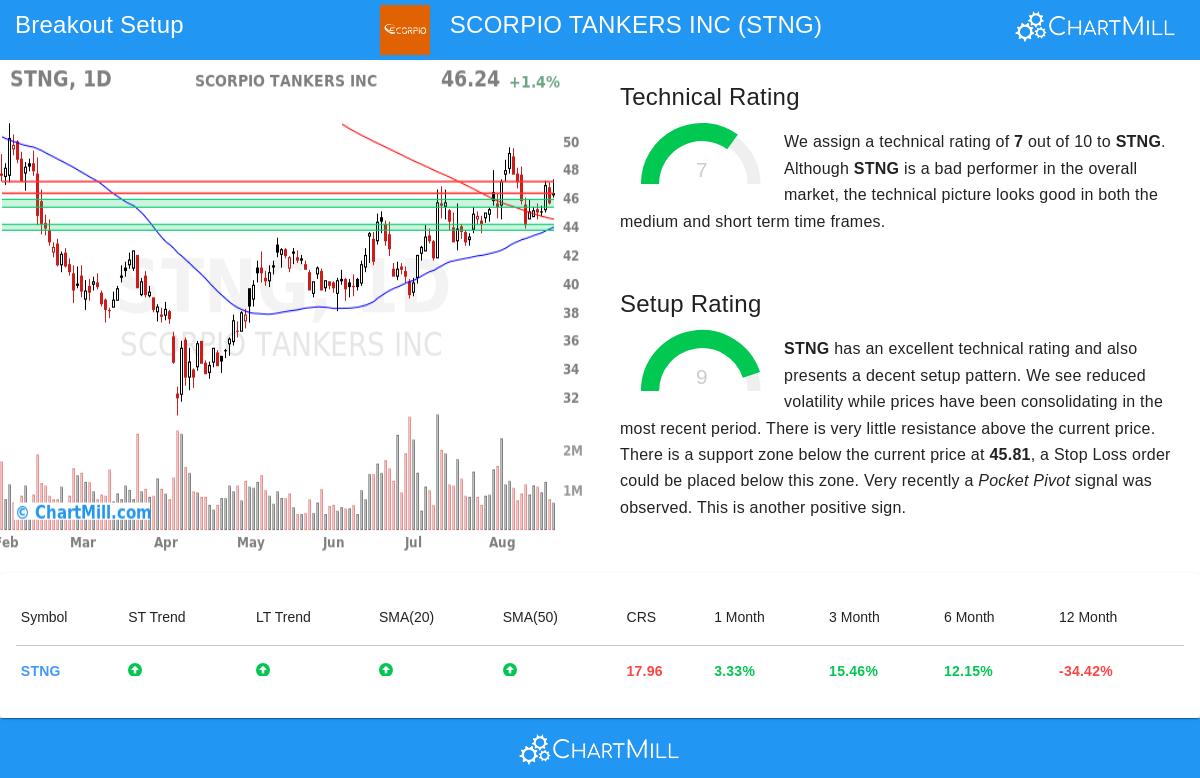
Scorpio Tankers demonstrates respectable technical strength with a ChartMill Technical Rating of 7, indicating the stock is in a confirmed uptrend. Both short-term and long-term trends are positive, supported by price trading above key moving averages including the 20-day SMA at $45.81, 50-day SMA at $43.86, and 100-day SMA at $41.03. This multi-layered moving average support structure typically indicates sustained buying interest across different time horizons. The stock has delivered solid intermediate-term performance with gains of 15.46% over three months and 12.15% over six months, though it has underperformed the broader market over the past year. While relative strength metrics show room for improvement compared to sector peers, the consistent positive momentum across multiple timeframes suggests underlying technical durability.
Setup Quality and Consolidation Pattern
The more notable aspect of Scorpio Tankers' current technical picture is its exceptional Setup Rating of 9, indicating a high-quality consolidation pattern. The stock has been trading within a defined range between $43.40 and $49.44 over the past month, with recent price action showing reduced volatility and tightening price movement, classic characteristics of a consolidation phase. The setup presents clearly defined support levels, most notably between $45.26-$45.81, which provides a logical area for stop-loss placement. Additionally, the appearance of a pocket pivot signal, where price advances on volume exceeding the maximum down volume of the previous ten days, suggests institutional accumulation occurring within this consolidation zone.
Breakout Parameters and Risk Management
The technical analysis suggests a potential breakout above the $46.24 resistance level, with an identified entry point at $46.25. This level represents a logical trigger point as it exceeds recent resistance while remaining close enough to the consolidation range to maintain favorable risk parameters. The proximity to support allows for a relatively tight stop-loss at $45.25, representing a risk of approximately 2.16% on the trade. The setup's quality is further enhanced by limited overhead resistance, suggesting potential for continued advancement should the breakout materialize. With an Average True Range of 3.5%, the proposed risk parameters appear reasonable relative to the stock's normal volatility.
Market Context and Implementation Considerations
The current positive trends in both the S&P 500's short-term and long-term trajectories provide a supportive backdrop for breakout setups. However, investors should note that Scorpio Tankers operates in the cyclical oil tanker industry, and fundamental factors including shipping rates, vessel supply-demand dynamics, and energy market conditions should be considered alongside technical patterns. The automated setup generated by the screening process provides a framework, but traders should adjust position sizing and risk parameters according to their individual risk tolerance and investment objectives.
For investors seeking similar technical breakout opportunities, additional candidates can be identified through the Technical Breakout Setups screen, which continuously scans the market for stocks exhibiting strong technical ratings coupled with high-quality setup patterns.
Disclaimer: This analysis is based on technical indicators and automated screening methodologies and should not be construed as investment advice. The mentioned security and trading parameters are for informational purposes only and do not constitute a recommendation to buy or sell any security. Investors should conduct their own research and consult with a qualified financial advisor before making investment decisions. Past performance is not indicative of future results, and all investments involve risk including possible loss of principal.