
SCORPIO TANKERS INC (NYSE:STNG) is a hidden gem unveiled by our stock screening tool, featuring a promising dividend outlook alongside solid fundamentals. STNG demonstrates decent financial health and profitability while ensuring a sustainable dividend. Let's break it down further.
Looking at the Dividend
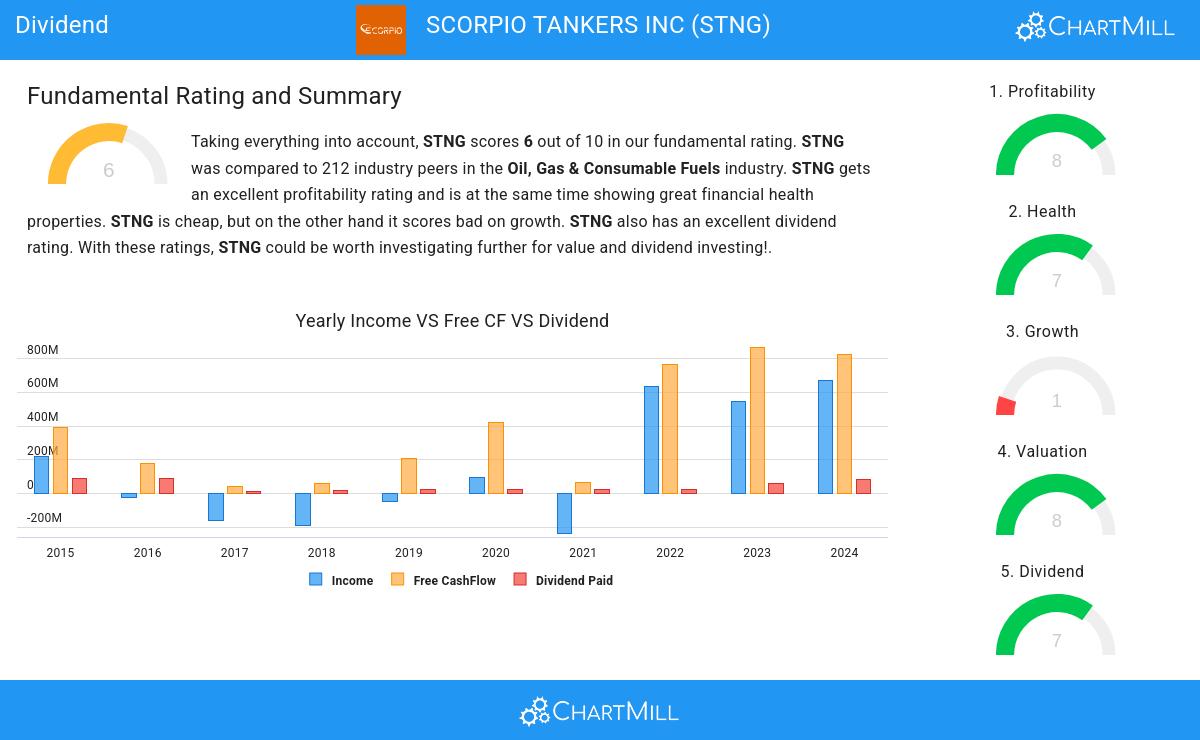
ChartMill assigns a Dividend Rating to each stock, ranging from 0 to 10. This rating is calculated by analyzing various dividend elements, such as yield, historical performance, dividend growth, and sustainability. STNG has been awarded a 7 for its dividend quality:
- With a Yearly Dividend Yield of 4.53%, STNG is a good candidate for dividend investing.
- STNG's Dividend Yield is rather good when compared to the S&P500 average which is at 2.51.
- On average, the dividend of STNG grows each year by 22.93%, which is quite nice.
- STNG has paid a dividend for at least 10 years, which is a reliable track record.
- 12.49% of the earnings are spent on dividend by STNG. This is a low number and sustainable payout ratio.
Analyzing Health Metrics
To gauge a stock's financial health, ChartMill utilizes a Health Rating on a scale of 0 to 10. This comprehensive evaluation encompasses liquidity and solvency, both in absolute terms and in comparison to industry peers. STNG has earned a 7 out of 10:
- STNG's Altman-Z score of 2.42 is fine compared to the rest of the industry. STNG outperforms 76.89% of its industry peers.
- STNG has a debt to FCF ratio of 1.04. This is a very positive value and a sign of high solvency as it would only need 1.04 years to pay back of all of its debts.
- With an excellent Debt to FCF ratio value of 1.04, STNG belongs to the best of the industry, outperforming 88.68% of the companies in the same industry.
- STNG has a Debt/Equity ratio of 0.25. This is a healthy value indicating a solid balance between debt and equity.
- STNG has a better Debt to Equity ratio (0.25) than 65.57% of its industry peers.
- STNG has a Current Ratio of 2.43. This indicates that STNG is financially healthy and has no problem in meeting its short term obligations.
- STNG has a better Current ratio (2.43) than 80.19% of its industry peers.
- A Quick Ratio of 2.39 indicates that STNG has no problem at all paying its short term obligations.
- Looking at the Quick ratio, with a value of 2.39, STNG is in the better half of the industry, outperforming 79.72% of the companies in the same industry.
Profitability Analysis for STNG
Discover ChartMill's exclusive Profitability Rating, a proprietary metric that assesses stocks on a scale of 0 to 10. It takes into consideration various profitability ratios and margins, both in absolute terms and relative to industry peers. Notably, STNG has achieved a 8:
- With an excellent Return On Assets value of 17.44%, STNG belongs to the best of the industry, outperforming 91.51% of the companies in the same industry.
- STNG's Return On Equity of 23.34% is amongst the best of the industry. STNG outperforms 83.96% of its industry peers.
- STNG has a better Return On Invested Capital (12.92%) than 82.08% of its industry peers.
- STNG has a Profit Margin of 53.76%. This is amongst the best in the industry. STNG outperforms 92.92% of its industry peers.
- STNG has a better Operating Margin (47.27%) than 89.15% of its industry peers.
- STNG's Operating Margin has improved in the last couple of years.
- The Gross Margin of STNG (74.34%) is better than 84.43% of its industry peers.
- STNG's Gross Margin has improved in the last couple of years.
More Best Dividend stocks can be found in our Best Dividend screener.
Our latest full fundamental report of STNG contains the most current fundamental analsysis.
Keep in mind
Important Note: The content of this article is not intended as trading advice. It is essential to perform your own analysis and exercise caution when making trading decisions. The article presents observations created by automated analysis but does not guarantee any trading or investment outcomes. Always trade responsibly and make independent judgments.