
Investors looking for companies with high growth potential frequently use a two-part method that brings together fundamental and technical analysis. This process finds stocks with good business performance while also displaying positive price movement patterns. The method concentrates on companies showing strong revenue and earnings increases, good profitability, and sound financial numbers, fundamental traits that point to lasting growth. At the same time, technical analysis assists in finding good entry positions by spotting breakout formations and support areas, letting investors get in as momentum starts to build. This unified method aims to capture the growth possibility of fast-expanding companies while controlling timing risk using technical signals.
SPORTRADAR GROUP AG-A (NASDAQ:SRAD) functions as a top supplier of sports betting and entertainment offerings, delivering combined sports data and technology systems that make customer activities easier and improve fan engagement. The company's B2B products assist the worldwide sports betting sector through data gathering, odds calculation, risk control, and platform operations.
Fundamental Strength Evaluation
Sportradar's fundamental picture shows several features common to solid growth companies. The company displays very good growth measurements with a Growth Rating of 9/10, backed by strong year-over-year results and future estimates. Important fundamental positives are:
- Earnings Per Share increase of 230.77% during the last year
- Revenue growth of 19.38% each year with a five-year average increase of 23.81%
- Projected future EPS growth of 66.45% per year from analyst forecasts
- High gross margin of 73.35%, doing better than 89% of similar companies
The company holds a sound financial health rating of 7/10, marked by acceptable debt amounts and good cash availability. While the profitability rating is 6/10, reflecting the company's continued spending on growth projects, the fundamental view overall indicates a business set for further growth. These number-based measurements match growth investing ideas, where investors look for companies showing fast earnings and revenue growth, even when current prices seem high compared to standard measures.
Technical Setup Evaluation
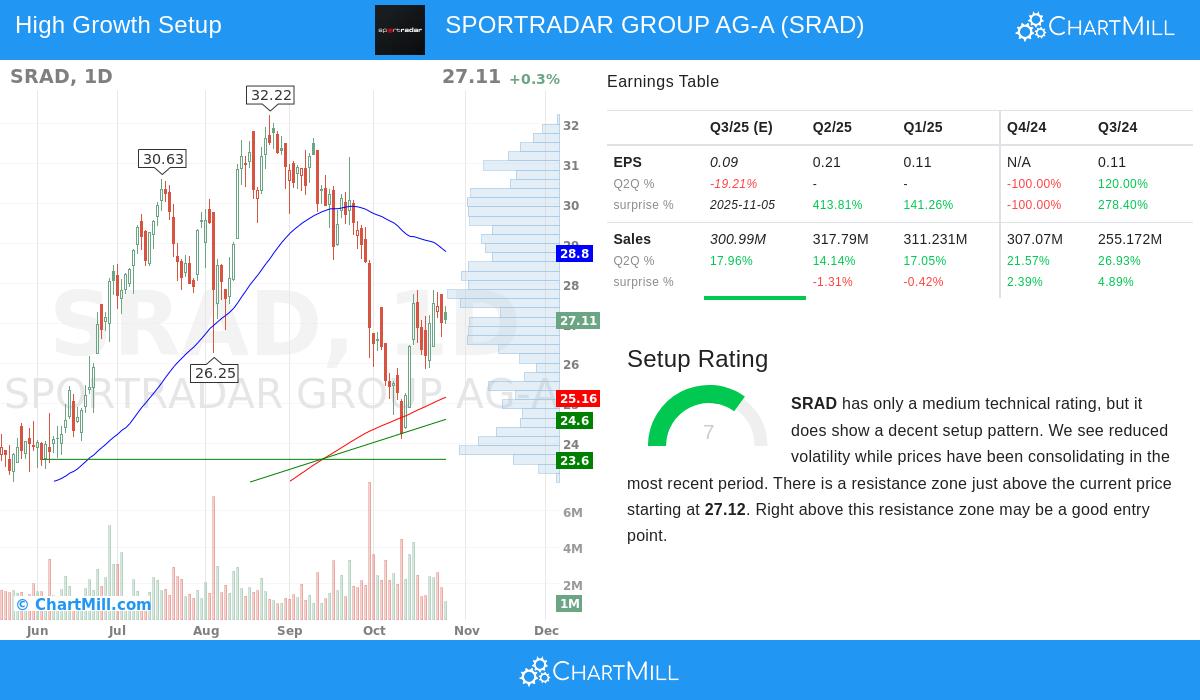
From a technical viewpoint, Sportradar shows an interesting setup with a Technical Rating of 6/10 and a more interesting Setup Rating of 7/10. The stock's technical formation shows it moving within a set band, indicating a chance for a clear directional move. Important technical points are:
- Long-term trend is still positive even with recent short-term sideways action
- Good relative performance, doing better than 91% of all stocks over the past year
- Defined support areas between $24.25-$24.91 and at $23.60
- Resistance zone found between $27.12-$27.66
The technical formation indicates the stock is gathering force for a possible move above the $27.12-$27.66 resistance area. A clear break above this level could mark the start of the next upward move, especially with the stock's good fundamental growth features. This technical state fits the screening method's goal of finding stocks that display both fundamental quality and technical breakout possibility.
Valuation Points
Sportradar's valuation shows a varied image that matches the growth stock model. While standard valuation numbers seem high, growth-related measures present another view:
- P/E ratio of 54.22 is more than the S&P 500 average but similar to industry counterparts
- Forward P/E of 48.89 stays above market averages
- PEG ratio shows acceptable valuation when considering growth projections
- Enterprise Value to EBITDA multiples are in line with industry norms
The valuation review points out the growth stock situation where investors accept high multiples for companies showing very good expansion possibility. The company's 9/10 growth rating and speeding up earnings path give background for the current valuation levels, indicating market players are accounting for continued solid results.
Industry Standing and Competitive Strengths
Sportradar works in the increasing sports betting and data analytics field, gaining from several market tailwinds. The company's market role as a leading B2B provider to the global sports betting industry gives competitive benefits through:
- Long-standing connections with sports leagues and betting companies
- Owned data gathering and calculation abilities
- Technology system serving various parts in the betting chain
- Involvement in the growing legalized sports betting market around the world
The company's 73.35% gross margin shows its ability to set prices and the worth of its data products, while its steady revenue growth signals solid market need for its services. These qualitative aspects support the number-based measurements and back the growth stock idea.
For investors wanting to find similar chances, other stocks meeting these requirements can be located using our Strong Growth Stocks with Good Technical Setup Ratings screening tool.
Disclaimer: This evaluation is built on fundamental and technical information available through ChartMill.com and is given for educational reasons only. It does not form investment guidance, nor does it suggest purchasing or selling any security. Investors should perform their own investigation and talk with financial consultants before making investment choices. Past results do not assure future outcomes, and all investments have risk including possible loss of initial investment.