
For growth-minded investors, high revenue and EPS growth are key criteria. Today, we'll examine whether SPORTRADAR GROUP AG-A (NASDAQ:SRAD) fits the bill for growth investing, particularly as it forms a base and hints at a potential breakout. Remember, due diligence is essential, but SPORTRADAR GROUP AG-A has caught our attention on our screen for growth with base formation. It may warrant additional investigation.
Growth Analysis for SRAD
ChartMill employs its own Growth Rating system for all stocks. This score, ranging from 0 to 10, is derived by evaluating different growth factors, such as EPS and revenue growth, taking into account both past performance and future projections. SRAD has earned a 8 for growth:
- SRAD shows a strong growth in Earnings Per Share. Measured over the last years, the EPS has been growing by 21.84% yearly.
- SRAD shows a strong growth in Revenue. In the last year, the Revenue has grown by 26.09%.
- Measured over the past years, SRAD shows a very strong growth in Revenue. The Revenue has been growing by 23.81% on average per year.
- SRAD is expected to show a strong growth in Earnings Per Share. In the coming years, the EPS will grow by 66.45% yearly.
- SRAD is expected to show quite a strong growth in Revenue. In the coming years, the Revenue will grow by 12.68% yearly.
- When comparing the EPS growth rate of the last years to the growth rate of the upcoming years, we see that the growth is accelerating.
Health Assessment of SRAD
To gauge a stock's financial health, ChartMill utilizes a Health Rating on a scale of 0 to 10. This comprehensive evaluation encompasses liquidity and solvency, both in absolute terms and in comparison to industry peers. SRAD has earned a 7 out of 10:
- SRAD has an Altman-Z score of 3.60. This indicates that SRAD is financially healthy and has little risk of bankruptcy at the moment.
- SRAD has a better Altman-Z score (3.60) than 83.09% of its industry peers.
- The Debt to FCF ratio of SRAD is 0.37, which is an excellent value as it means it would take SRAD, only 0.37 years of fcf income to pay off all of its debts.
- SRAD has a better Debt to FCF ratio (0.37) than 92.65% of its industry peers.
- SRAD has a Debt/Equity ratio of 0.04. This is a healthy value indicating a solid balance between debt and equity.
- SRAD has a better Debt to Equity ratio (0.04) than 87.50% of its industry peers.
- With a decent Current ratio value of 1.53, SRAD is doing good in the industry, outperforming 73.53% of the companies in the same industry.
- With a decent Quick ratio value of 1.53, SRAD is doing good in the industry, outperforming 77.21% of the companies in the same industry.
Profitability Examination for SRAD
ChartMill assigns a proprietary Profitability Rating to each stock. The score is computed by evaluating various profitability ratios and margins and ranges from 0 to 10. SRAD was assigned a score of 6 for profitability:
- SRAD has a better Return On Equity (3.69%) than 60.29% of its industry peers.
- The 3 year average ROIC (3.32%) for SRAD is below the current ROIC(5.14%), indicating increased profibility in the last year.
- With a decent Operating Margin value of 12.16%, SRAD is doing good in the industry, outperforming 61.03% of the companies in the same industry.
- SRAD has a better Gross Margin (73.42%) than 90.44% of its industry peers.
Looking at the Setup
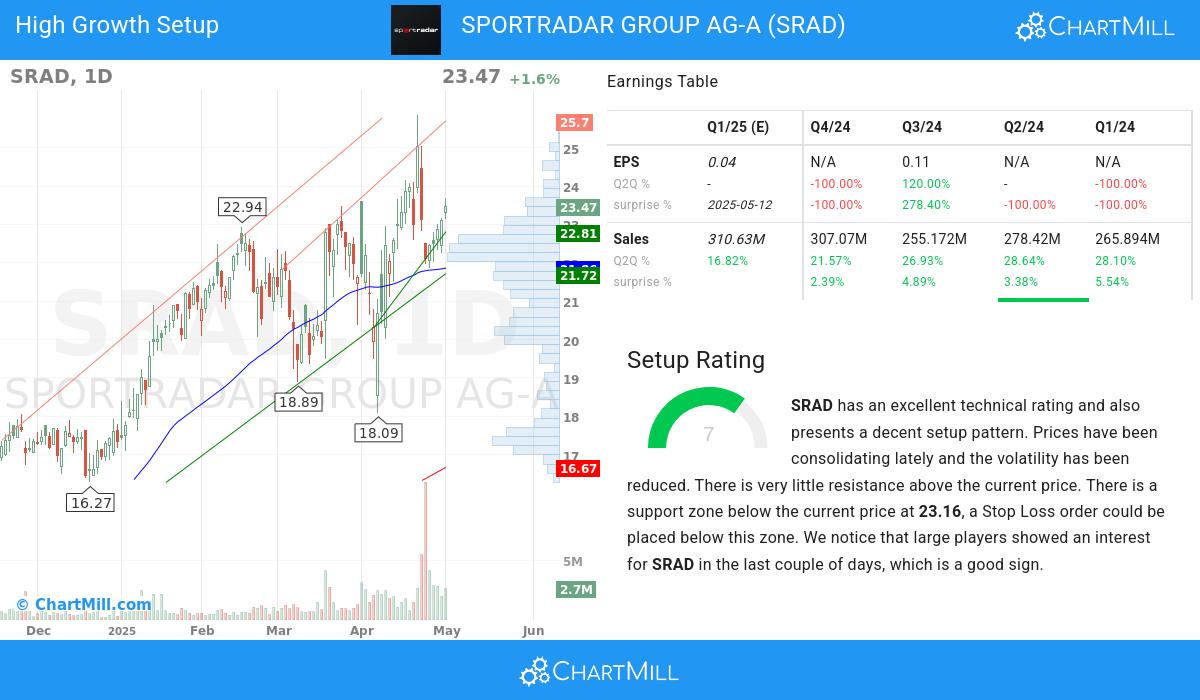
ChartMill also provides a Setup Rating for each stock. This rating, ranging from 0 to 10, assesses the extent of consolidation in the stock based on multiple short-term technical indicators. Currently, SRAD has a 7 as its setup rating:
SRAD has an excellent technical rating and also presents a decent setup pattern. Prices have been consolidating lately and the volatility has been reduced. There is very little resistance above the current price. There is a support zone below the current price at 23.16, a Stop Loss order could be placed below this zone. We notice that large players showed an interest for SRAD in the last couple of days, which is a good sign.
Our Strong Growth screener lists more Strong Growth stocks and is updated daily.
Check the latest full fundamental report of SRAD for a complete fundamental analysis.
Our latest full technical report of SRAD contains the most current technical analsysis.
Disclaimer
This is not investing advice! The article highlights some of the observations at the time of writing, but you should always make your own analysis and invest based on your own insights.