
For investors using a technical breakout method, the aim is to spot stocks that are technically sound and ready for a move soon. This method usually uses two main proprietary metrics from ChartMill: a high Technical Rating, showing the stock is in a good, steady uptrend, and a high Setup Quality Rating, showing the stock is trading in a narrow range, giving a specific entry point with clear risk. Using these scores together, traders try to locate chances in strong stocks that are gathering force for their next rise.
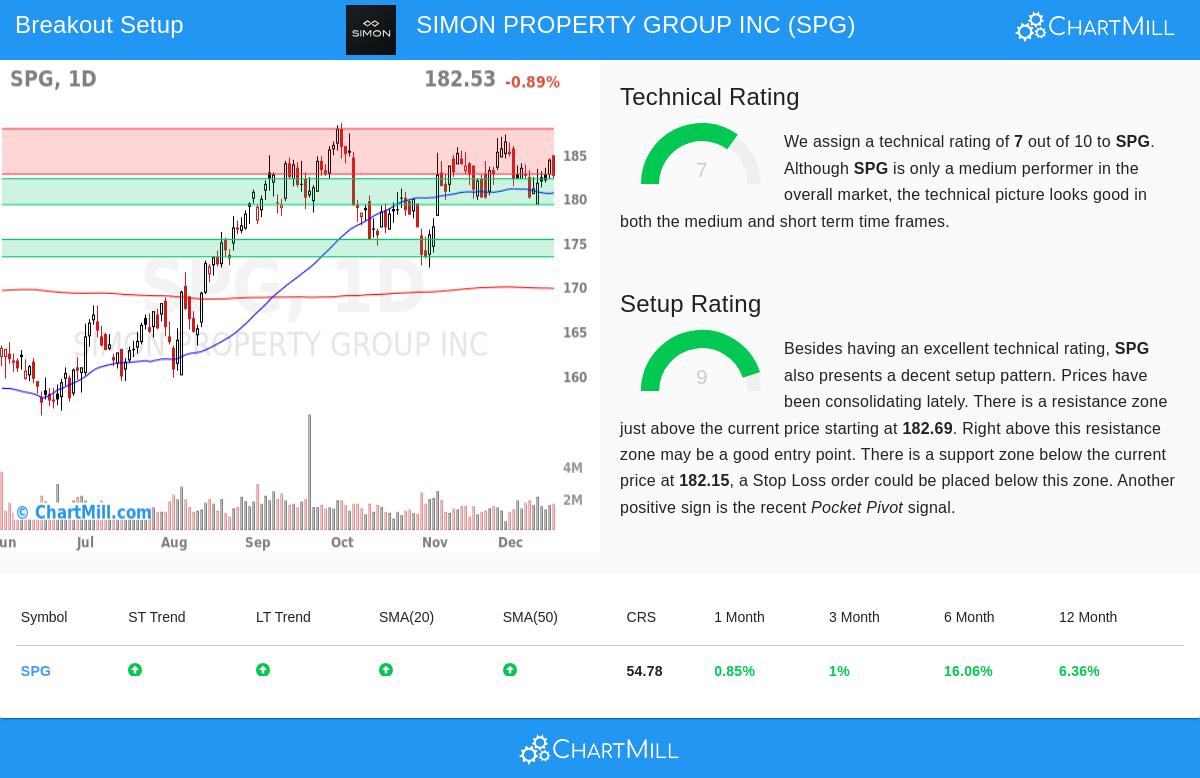
SIMON PROPERTY GROUP INC (NYSE:SPG) now shows a profile that fits this breakout method. The mall REIT's technical report shows a good base for a possible move, backed by a Technical Rating of 7 and a very good Setup Quality Rating of 9.
Technical Strength: A Good Base
The center of any breakout method is first making sure the main trend is positive. A stock can have an ideal consolidation shape, but if it is happening inside a bigger decline, the chance of a good breakout falls. SPG's technical profile gives the needed positive background.
According to the detailed technical report, the stock shows soundness across several timeframes, which is exactly what the Technical Rating is made to measure. Important good points include:
- Positive Trends: Both the long-term and short-term trends for SPG are marked as positive, showing matching momentum.
- Sound Moving Average Position: The stock is priced above its important moving averages (20, 50, and 100-day SMAs), and these averages are themselves in rising arrangements, a standard sign of basic soundness.
- Sturdy Performance: Over the last six months, SPG has recorded an increase of over 16%, doing much better than its 12-month return and showing recent speeding up.
While the report notes SPG's performance is close to the wider market over the last year, its recent price action and trend alignment lead to a Technical Rating of 7. This score puts it clearly in the "uptrend" group, meeting the first important filter for a breakout candidate by confirming the stock's technical condition is good.
Setup Quality: The Consolidation Before the Move
A sound trend by itself is not a signal to buy, entering a stock that has just made a big, long move often results in buying at a high point. This is where the Setup Quality Rating becomes key. It finds times of consolidation or "narrow" trading, where volatility lessens and the stock forms a base for its next rise. SPG now scores a 9 out of 10 on this metric.
The technical report points out the traits that add to this high setup score:
- Narrow Trading Range: Over the last month, SPG has traded in a tight area between about $179.25 and $187.20. This squeezing of price action is a sign of a good-quality setup.
- Clear Support and Resistance: The analysis finds a specific support area from $179.23 to $182.15, made by a mix of trendlines and moving averages. Just above the current price sits a resistance area from $182.69 to $187.79. These clear levels allow for exact planning of entry and stop-loss orders.
- Positive Signal: The report also notes a recent "Pocket Pivot" signal, a volume-based indicator that hints at buying by bigger participants, adding more support to the positive setup.
This mix, a narrow range near the top of its recent consolidation, with specific borders, is what breakout traders seek. It hints the stock is tightening, and a move above the noted resistance could mark the start of a new upward stage.
A Sample Trading Plan
Based on this analysis, the technical report suggests a possible trading setup that shows the breakout method. The suggested entry is a buy-stop order at $184.87, placed just above the recent consolidation high to confirm momentum. A stop-loss order at $179.25, placed below the important support area, would set the risk. This plan limits the possible loss on the trade to about 3%, a measurable risk that is central to careful technical trading.
It is very important to know this is an example made from the analysis, not a suggestion. Traders must always do their own analysis, change settings to match their own risk comfort, and know about outside factors like coming company earnings or bigger economic events.
Locating Similar Chances
The screening process that found SPG can be used each day to find new possible breakout setups across the market. For investors wanting to see a current list of stocks that meet similar standards of good technicals and high-quality consolidations, the Technical Breakout Setups screen is refreshed often with new results.
Disclaimer: This article is for information only and is not investment advice, a suggestion, or an offer to buy or sell any security. The analysis uses technical metrics and past data, which are not promises of future results. Investing has risk, including the possible loss of principal. Always do your own research and think about your money situation and risk comfort before making any investment choices.