
SOLVENTUM CORP (NYSE:SOLV) has been identified as a potential breakout candidate by our technical screening tools. The stock combines a high technical rating with a strong setup pattern, suggesting it may be well-positioned for further gains.
Technical Strength
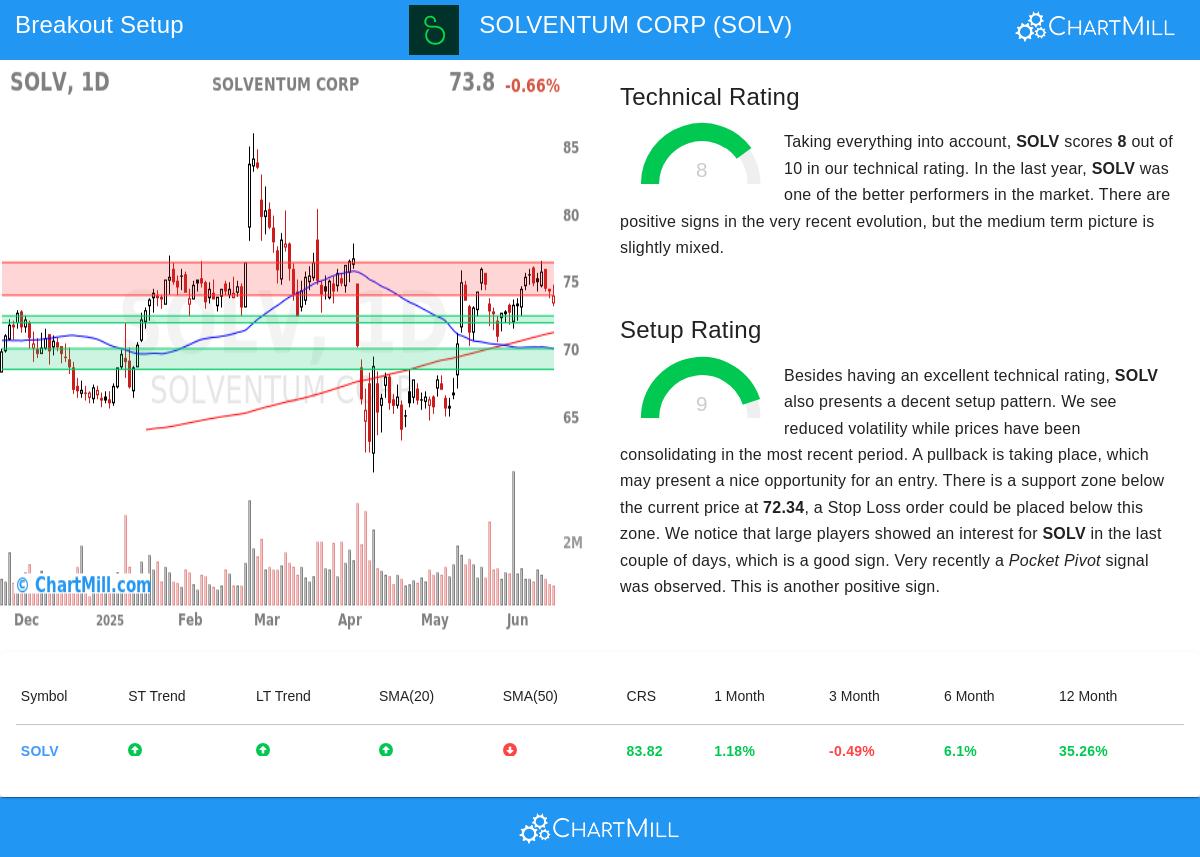
- Rating of 8/10: SOLV demonstrates solid technical health, with both short-term and long-term trends currently positive.
- Market outperformance: Over the past year, the stock has outperformed 83% of the market and ranks in the top tier of its industry (Health Care Equipment & Supplies).
- Support levels: Multiple support zones exist between $71.82 and $72.34, backed by moving averages and trendlines, providing a cushion against pullbacks.
- Liquidity: Average daily volume of 1.18 million shares ensures good tradability.
Setup Quality
- Rating of 9/10: The stock is consolidating within a defined range ($70.41 - $76.38), with reduced volatility signaling a potential breakout opportunity.
- Recent accumulation: Large players have shown interest, and a recent Pocket Pivot signal suggests underlying strength.
- Entry/Exit levels: The setup suggests an entry above $74.58 (near the 10-day moving average) with a stop-loss below $71.93 (just under the 10-day low).
For a deeper look at the technicals, review the full technical report for SOLV.
Our Technical Breakout Setups screener updates daily with new potential breakout candidates.
Disclaimer
This is not investment advice. Always conduct your own analysis and consider risk management before trading.