
We've identified SLM CORP (NASDAQ:SLM) as a potential breakout candidate based on our stock screener's analysis. This breakout setup pattern suggests that after a strong uptrend, the stock is currently consolidating, potentially signaling a continuation of the trend. Keep an eye on NASDAQ:SLM for further developments.
Deciphering the Technical Picture of SLM
ChartMill assigns a Technical Rating to every stock. This score ranges from 0 to 10 and is updated daily. The score is determined by evaluating multiple technical indicators and properties.
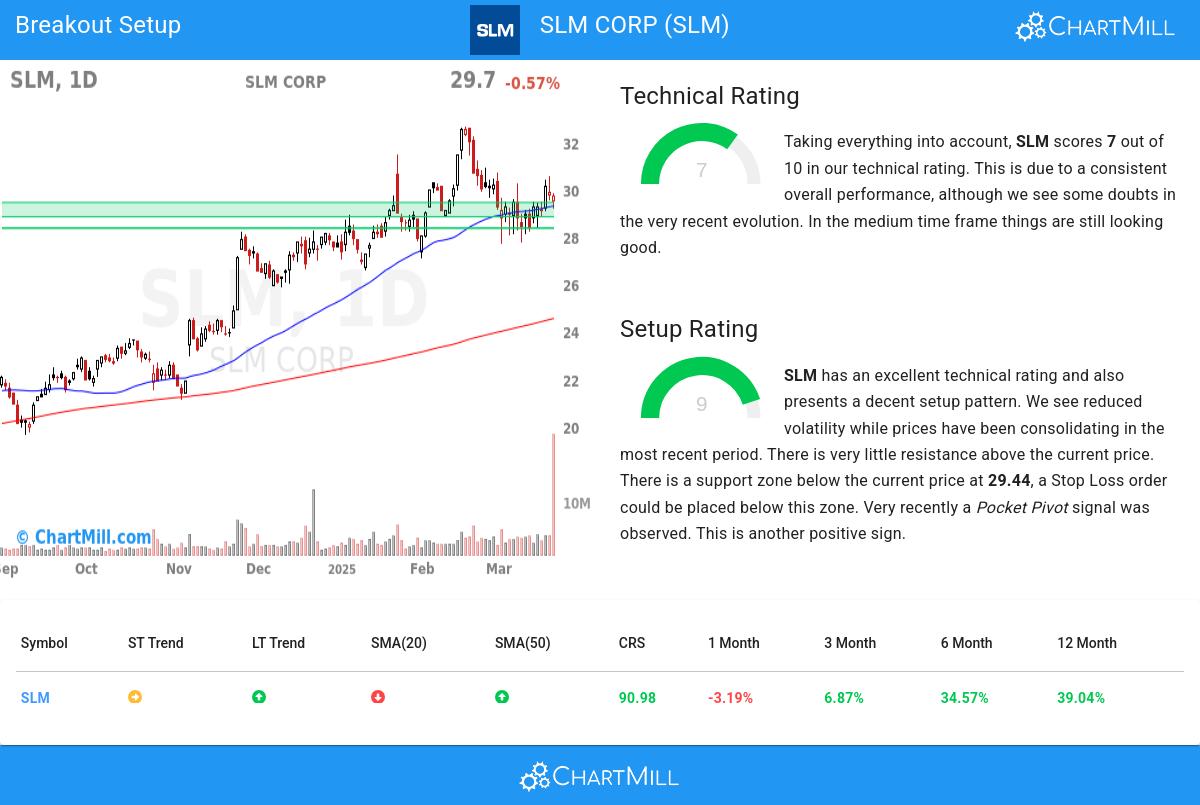
Overall SLM gets a technical rating of 7 out of 10. In the last year, SLM was one of the better performers, but we do observe some doubts in the very recent evolution.
- The short term is neutral, but the long term trend is still positive. Not much to worry about for now.
- Looking at the yearly performance, SLM did better than 90% of all other stocks.
- SLM is currently trading in the upper part of its 52 week range. The market is still in the middle of its 52 week range, so SLM slightly outperforms the market at the moment.
- SLM is an average performer in the Consumer Finance industry, it outperforms 65% of 53 stocks in the same industry.
- In the last month SLM has a been trading in the 27.70 - 31.22 range, which is quite wide. It is currently trading in the middle of this range, so some resistance may be found above.
- Volume is considerably higher in the last couple of days.
For an up to date full technical analysis you can check the technical report of SLM
How does the Setup look for SLM
ChartMill incorporates a Setup Rating in its analysis, which measures the extent of consolidation in a stock over recent days and weeks. This rating, ranging from 0 to 10, is updated daily and takes into account multiple short-term technical indicators. The current setup rating for SLM is 9:
Besides having an excellent technical rating, SLM also presents a decent setup pattern. Prices have been consolidating lately and the volatility has been reduced. There is very little resistance above the current price. There is a support zone below the current price at 29.44, a Stop Loss order could be placed below this zone. Another positive sign is the recent Pocket Pivot signal.
How to trade SLM?
A breakout opportunity may arise when the stock surpasses the current consolidation zone and reaches new highs. Traders often wait for this breakout before considering buying the stock. To manage risk, a stop loss order could be placed below the consolidation zone to limit potential losses.
Of course, there are many ways to trade or not trade SLM and this article should in no way be interpreted as trading advice. The article is purely based on an automated technical analysis and just points out the technical observations. Always make your own analysis and trade at your own responsibility.
More breakout setups can be found in our Breakout screener.
Keep in mind
This article should in no way be interpreted as advice. The article is based on the observed metrics at the time of writing, but you should always make your own analysis and trade or invest at your own responsibility.