
For technical investors aiming to find stocks ready for their next advance, a frequent method uses two main ideas: the force of the existing trend and the state of the present price formation. The aim is to locate stocks that are both in a verified upward trend and are also settling in a narrow band, preparing for a possible upward move. This method removes weaker stocks in downward trends and steers clear of buying into overstretched advances that are likely to retreat. A stock that performs favorably on both trend force and formation state can offer a measured chance.
SLB LTD (NYSE:SLB), the worldwide energy technology company previously called Schlumberger, now shows a picture that fits this upward move method. The company’s work covers the full energy sequence, from digital tools and reservoir oversight to well building and production systems. From a chart analysis view, the stock’s recent activity indicates it could be gathering force for a notable price change.
Technical Force: A Firm Base
The first part of the upward move method is finding stocks with sound underlying chart condition. A forceful trend supplies the push that can drive a stock upward once it moves out of its settling phase. SLB’s chart picture, as described in its ChartMill Technical Analysis report, displays multiple good features.
- Trend Agreement: Both the near-term and longer-term trends for SLB are scored as good. This agreement across different periods is a main sign of continued buyer activity and lowers the chance of an abrupt trend change.
- Moving Average Backing: The stock is priced above its important moving averages, which include the 20-day, 50-day, and 100-day Simple Moving Averages (SMAs), all moving upward. This arrangement shows a healthy, step-by-step upward trend where these averages can serve as flexible support points.
- Relative Results: While SLB is doing better than most stocks in the wider market and its Energy Equipment & Services industry group, it is seen as trading in the center of its own 52-week band. This indicates there is possible space for more gain if the good trend persists, particularly as the overall market trades near peak levels.
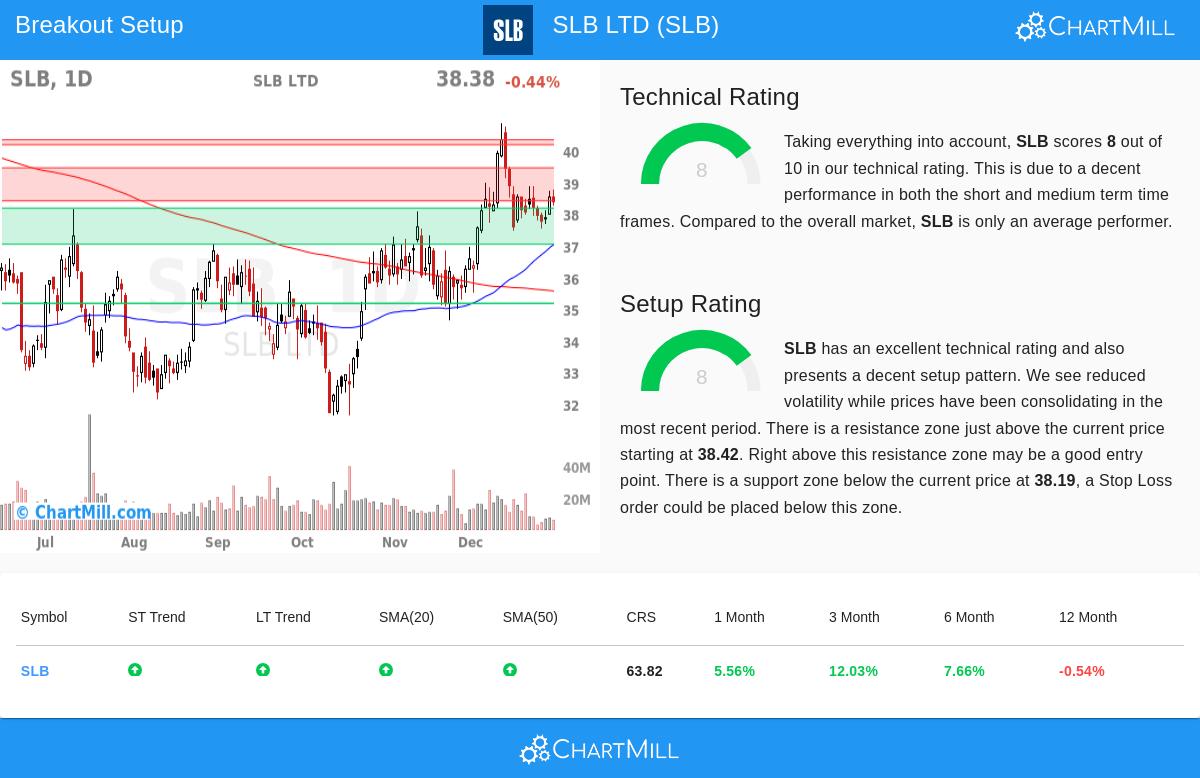
This mix of elements helps SLB receive a ChartMill Technical Rating of 8 out of 10, marking it as a stock in a definite upward trend and giving the needed "technical force" base for the method.
Formation State: The Settling Phase Before the Change
A forceful trend by itself is not a signal to buy; entering at a poor moment can result in quick losses. The second vital piece is the "formation state," which searches for times of settling or basing. These are stages where the stock absorbs its earlier gains, price swings often lessen, and a new support level forms. This creates a more distinct risk level for traders.
SLB’s present chart formation shows multiple traits of a good-quality formation, seen in its Setup Rating of 8.
- Price Settling: During the last month, SLB has traded inside a set band between about $36.23 and $40.88. The report states it is now trading in the middle of this band, where prices have been settling. This time of sideways movement after a rise helps reduce overbought states.
- Set Support and Resistance: The chart analysis clearly marks nearby support and resistance areas. An important support area lies between $37.05 and $38.19, made by a combination of moving averages and trend lines. Just above the present price, a resistance area is between $38.42 and $39.46.
- Lessened Swings: The formation summary mentions "lessened swings while prices have been settling," which is a typical sign before a swing increase, often an upward move.
This organized setting allows for a planned trade approach. The method proposes a possible entry point just above the marked resistance area (near $39.47), with a stop-loss order set below the nearby support (near $37.52). This supplies a clear, rule-based structure for handling the trade.
Conclusion and View
For technical investors, SLB stands as a candidate where the basic parts of an upward move trade are visible. The stock has the needed technical force from its good multi-period trend, and it is now showing the settling behavior that often comes before a new directional change. The set support and resistance levels give concrete reference points for entry and risk control.
It is key to recall that a good-quality formation shows a possible chance for an upward move; it does not assure one. The trade must be confirmed by the stock’s price action actually moving past the noted resistance level with convincing trade volume.
Want to find more possible upward move formations like SLB? You can use the same scanning method with the Technical Breakout Setups screen to see a daily-refreshed list of stocks meeting similar standards for technical force and formation state.
,
Disclaimer: This article is for information only and is not investment guidance, a suggestion, or a proposal to buy or sell any security. The examination uses chart indicators and past information, which are not promises of future results. Investing carries risk, including the possible loss of initial funds. Always do your own study and think about your money situation and risk comfort before making any investment choices.
