
In the field of growth investing, merging a solid technical structure with notable fundamental momentum can be an effective method for spotting possible leaders. One technique that represents this is the system made famous by Mark Minervini, which depends on his Specific Entry Point Analysis (SEPA). This process focuses on trading stocks that are in established uptrends, supported by quickening earnings and sales growth, while using defined risk rules. The aim is to seize the middle, most dynamic part of a stock's rise by getting in at exact, controlled-risk moments. A central instrument in this system is the Minervini Trend Template, a group of technical checks meant to confirm a stock is in a notable, high-quality uptrend before it is reviewed for a trade.
For investors concentrating on notable-growth possibilities, adding fundamental momentum checks can better narrow the search. These checks seek companies showing outstanding and quickening growth in earnings and revenue, traits that frequently come before major price gains. By checking for stocks that meet both the firm technical rules of the Trend Template and show high fundamental growth momentum, investors can build a narrowed watchlist of prospects that are technically healthy and fundamentally set for possible growth.
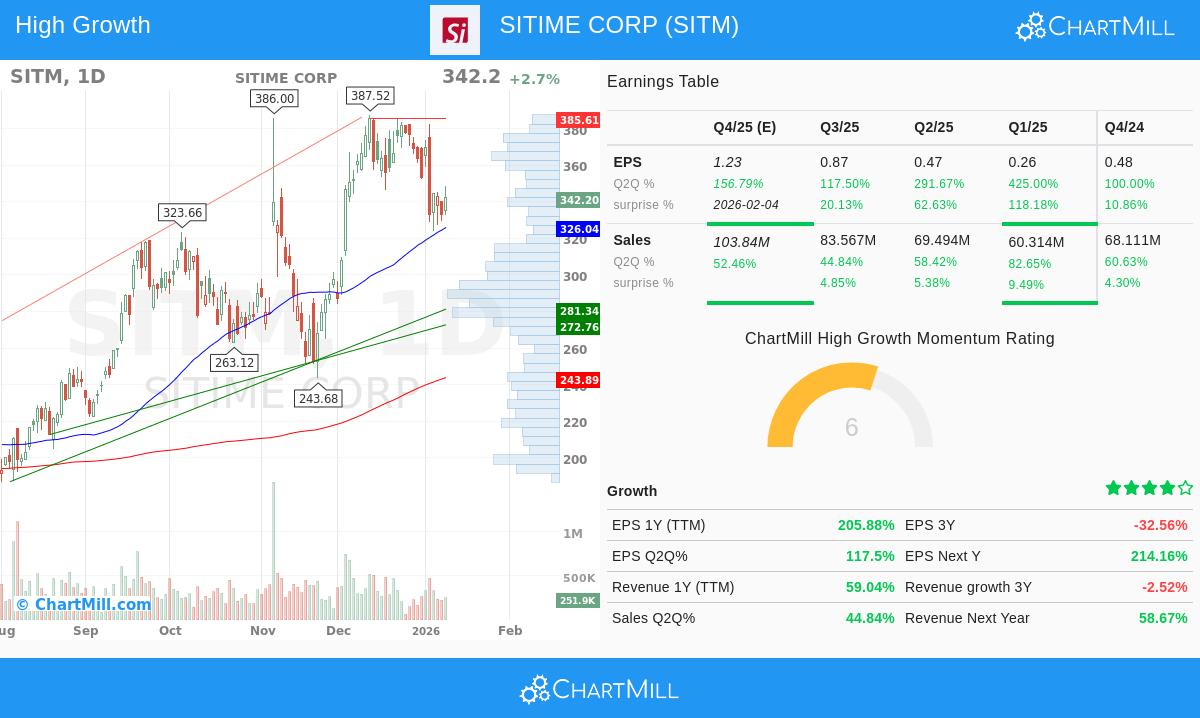
SiTime Corp (NASDAQ:SITM) offers a strong example for this merged method. The company providing MEMS-based silicon timing solutions has displayed a notable price run over the last year, and a detailed review shows it meets many of the needs required by an orderly growth and momentum system.
Matching the Minervini Trend Template
The Minervini Trend Template is not an idea but a firm list of requirements. Its goal is to remove all but the strongest stocks, making sure an investor's focus is on issues where the main trends are clearly positive and in agreement. For SiTime, the technical agreement is evident:
- Price Above Key Moving Averages: The stock's last price of $342.20 trades well above its rising 50-day ($326.04), 150-day ($269.38), and 200-day ($243.89) simple moving averages (SMAs). This order confirms the stock is in a maintained uptrend across several timeframes.
- Moving Average Order: The 50-day SMA is above the 150-day SMA, which is above the 200-day SMA. This "ordered" setup of shorter-term averages above longer-term ones is a standard sign of notable bullish momentum and institutional buying.
- Nearness to Highs: A central idea of the Minervini method is to concentrate on strength, not weakness. SITM's present price is about 225% above its 52-week low of $105.40, showing notable recovery and trend strength. Also, it is trading within about 12% of its 52-week high of $387.52, showing it is acting like a market leader, not a follower.
- Notable Relative Strength: With a ChartMill Relative Strength (CRS) score of 88.8, SITM has done better than nearly 89% of all stocks over the last year. Minervini notes that the largest winners frequently show high relative strength early, indicating they are being sought by the market despite wider conditions.
This technical view meets the main aim of the Trend Template: to spot stocks in a confirmed Stage 2 rise, where the easiest path is higher and the trend is backed by several measures.
Showing High-Growth Momentum
While a healthy chart is necessary, the Minervini system states it must be driven by outstanding business results. This is where the "high growth momentum" part becomes key. SITM's fundamental measures show a company in the middle of a notable growth phase:
- Dynamic Earnings Growth: The company's earnings per share (EPS) growth is striking. Year-over-year EPS growth is at 205.9%, and the latest quarter showed a rise of 117.5% compared to the same time last year. Even more notable is the quickening seen in earlier quarters, with growth rates of 291.7% and 425.0% in the two quarters before that. This sequence of quickening earnings is a sign of companies going through a fundamental surge.
- Steady Earnings Surprises: SITM has exceeded analyst EPS estimates in each of the last four quarters, with an average beat of over 52%. This steady overperformance implies management action is beating expectations, often leading to positive estimate changes and greater investor trust.
- Healthy Sales Growth: Top-line growth is also notable, with revenue up 59.0% over the trailing twelve months. Recent quarterly sales growth stays healthy at 44.8%, and the company has also beaten revenue estimates in four straight quarters.
- Positive Analyst Changes: The view on Wall Street is supporting this growth story. Analyst estimates for next year's EPS have been changed upward by 28.2% over the last three months, while revenue estimates have been raised by 8.7%. These upward changes are a key factor that can lead to more institutional buying.
This mix of healthy technicals and dynamic, quickening fundamentals creates the "drive" for the trend. In Minervini's SEPA structure, the notable earnings and sales growth act as the fundamental cause that draws the institutional buying pressure seen in the stock's notable chart action.
Technical Condition and Present Position
According to ChartMill's own analysis, SITM gets a healthy Technical Rating of 8 out of 10, confirming its place as a technically sound stock in a long-term positive trend. The report states the stock has been a top performer over the last year. However, it also mentions that the short-term trend has lately become neutral, and the stock is trading in the lower part of its one-month range. This has led to a lower Setup Quality rating of 3, showing that while the long-term trend is unchanged, the stock is not presently in a tight, low-volatility pause that would offer a perfect, controlled-risk entry point as described by shapes like the Volatility Contraction Pattern (VCP).
For an investor following the Minervini system, this implies SITM is a stock to monitor carefully. It has all the traits of a leading growth stock, including a healthy trend, high relative strength, and dynamic fundamentals, but may need a time of pause to work through its latest gains and form a new base before giving a more exact entry signal. A full review of the technical picture, including key support and resistance points, is available in the full ChartMill Technical Report for SITM.
Locating Comparable Possibilities
SiTime Corp shows the kind of prospect that appears when checking for both technical trend strength and high fundamental growth momentum. Investors seeking to use this orderly method to the wider market can use ready-made checks to simplify their study. For more possible prospects that meet similar rules of the Minervini Trend Template combined with high growth momentum, you can see the results of this specific check here.
Disclaimer: This article is for informational and educational purposes only. It does not constitute a recommendation to buy, sell, or hold any security, nor is it investment advice. The analysis is based on data provided and certain methodologies, but past performance is not indicative of future results. Investors should conduct their own due diligence and consider their individual financial situation and risk tolerance before making any investment decisions.