
The Caviar Cruise screening method represents a systematic way to approach quality investing, focusing on companies with solid historical performance, high profitability, and lasting financial health. This strategy, influenced by Belgian author Luc Kroeze's work, stresses finding businesses with lasting competitive edges that can provide steady returns over long periods. The screen assesses several financial measures including revenue growth, EBIT expansion, return on invested capital, debt management, and profit quality to find companies suitable for long-term holding.
SHERWIN-WILLIAMS CO/THE (NYSE:SHW) appears as a strong candidate when viewed through this quality-focused method. The Cleveland-based paint and coatings maker displays several traits that match the Caviar Cruise method's strict standards for finding high-caliber businesses.
Financial Performance and Growth Measures
The company's historical performance shows a trend of controlled growth and operational effectiveness. While revenue growth over the last five years is 3.87%, a bit under the screen's 5% minimum, this number should be viewed with other performance signs. More importantly, SHERWIN-WILLIAMS has reached an EBIT growth rate of 9.18% per year over the same term, comfortably above the 5% requirement. This difference between revenue and EBIT growth points to better operational effectiveness and possible pricing strength, exactly the kind of trait quality investors look for, as it implies the company can create greater profit growth from small revenue gains.
- EBIT Growth (5Y CAGR): 9.18% (above 5% threshold)
- Revenue Growth (5Y CAGR): 3.87% (under 5% threshold but with better profitability)
- EBIT growth is higher than revenue growth, showing operational effectiveness gains
Profitability and Capital Effectiveness
SHERWIN-WILLIAMS shows outstanding capital allocation skill, with a Return on Invested Capital excluding cash, goodwill, and intangibles (ROICexgc) of 38.96%. This is much higher than the screen's 15% requirement and puts the company in the top group of effective capital users. High ROIC is especially important for quality investors because it shows management's skill in creating high returns from invested capital, building shareholder value through good reinvestment of earnings instead of just business growth.
- ROICexgc: 38.96% (much higher than 15% requirement)
- Outstanding capital effectiveness indicating high-level management execution
- Lasting competitive edges allowing high returns on investments
Financial Health and Cash Flow Quality
The company keeps a controlled method for debt management, with a Debt to Free Cash Flow ratio of 4.96, just below the screen's highest limit of 5. This shows that SHERWIN-WILLIAMS could pay off all its debt in about five years using current free cash flow creation. Also, the company shows high profit quality, with a five-year average Free Cash Flow to Net Income ratio of 100.89%, above the 75% benchmark. This measure is key for quality investors because it shows the company's ability to turn accounting profits into real cash, a main sign of earnings sustainability and financial strength.
- Debt/FCF: 4.96 (within acceptable range under 5)
- Profit Quality (5y average): 100.89% (above 75% requirement)
- Solid cash conversion supporting financial stability and flexibility
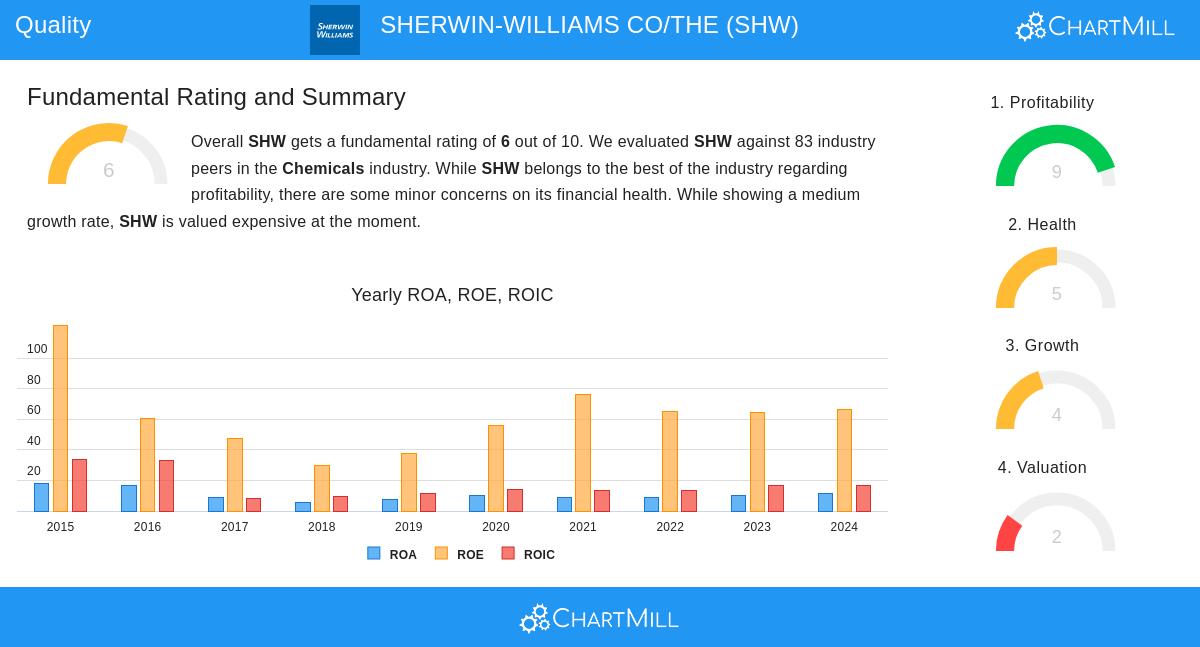
Fundamental Analysis Overview
According to the detailed fundamental analysis, SHERWIN-WILLIAMS gets an overall score of 6 out of 10, with special strength in profitability where it scores 9 out of 10. The analysis points out the company's high return measures, including a 57.83% Return on Equity and 14.97% Return on Invested Capital, both much higher than industry peers. Margin growth across gross, operating, and profit margins further supports the quality story. However, the report mentions valuation issues with a Price/Earnings ratio of 29.87 and some liquidity difficulties, though these are partly balanced by the company's solid solvency position and steady share reduction through buybacks.
Quality Investment Points
Beyond the number-based measures, SHERWIN-WILLIAMS has several non-number-based features that attract quality investors. The company gains from solid brand awareness in the paint and coatings industry, works globally through its three business parts, and keeps a fairly simple business model that is easy to grasp. The company's pricing strength, shown by growing margins even with moderate revenue growth, implies lasting competitive edges. Also, the necessary nature of its products gives some economic downturn protection, though not full safety from economic changes.
For investors wanting to look at other companies that meet the Caviar Cruise quality rules, the full screen results give more investment ideas that have passed these strict quality filters.
Disclaimer: This analysis is for information only and is not investment advice, a suggestion, or a support of any security. Investors should do their own research and talk to financial advisors before making investment choices. Past results do not ensure future outcomes.