
For investors focused on chart patterns and momentum, a systematic method for spotting possible breakouts can simplify the search for opportunities. One technique uses filters to find stocks that show technical strength and are creating a positive consolidation pattern. This two-step plan tries to find stocks with clear upward momentum as they rest and prepare for a possible next rise. A stock now matching this description is Steven Madden Ltd (NASDAQ:SHOO), a designer and seller of fashion footwear and accessories.
Examining the Technical Strength
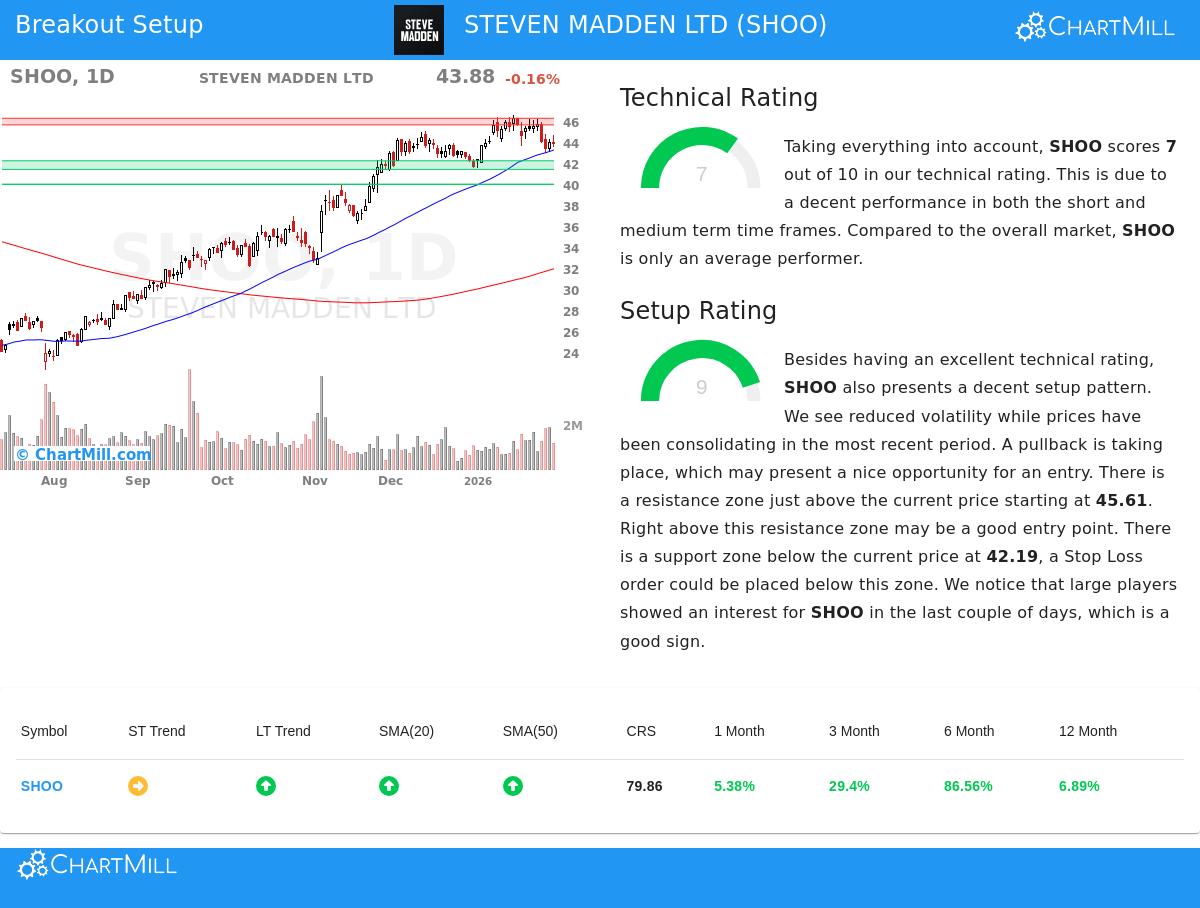
The base of a breakout setup is a stock showing good technical condition. The ChartMill Technical Rating for SHOO is a 7 out of 10, pointing to a good bullish base. This number combines several parts from different time periods to measure the stock's trend and momentum compared to the wider market.
Important parts adding to this rating are:
- Clear Long-Term Uptrend: The stock's long-term trend is marked as positive, a key setting for any breakout try. This is seen as the stock trades notably above its main rising moving averages (50-day, 100-day, and 200-day).
- Good Relative Performance: SHOO is doing better than 81% of the stocks in its Textiles, Apparel & Luxury Goods industry group. Also, it is trading close to its 52-week high of $46.55, a mark of strength, though it is seen this performance matches the general market.
- Positive Medium and Short-Term Trends: While the short-term trend is now neutral, the technical report states the view stays positive in both medium and short-term periods. The stock has recorded large gains over the last three and six months.
This technical rating addresses the "which stock" question for a momentum investor. A score of 7 or more implies the stock is in a clear uptrend, making it a better choice for a breakout plan than a stock stuck in a downtrend or a flat range.
Assessing the Setup Quality
A strong trend by itself is not a buy signal; buying at a high price can cause quick declines. This is where the "when to buy" question is answered by the setup's quality. SHOO does well here, receiving a high Setup Rating of 9 out of 10. This score measures if the stock is making a positive consolidation, giving a clear spot for entry and a sensible level to set a protective stop-loss order.
The present pattern for SHOO displays several good traits:
- Consolidation Inside a Range: Over the last month, SHOO has been trading between about $41.51 and $46.55. It is now placed in the middle of this range, having moved down from recent highs. This tightening action after a strong rise is common for a rest period before a possible next climb.
- Clear Support and Resistance: The analysis finds a definite support area between $41.37 and $42.19, made by a mix of trendlines and moving averages. Just above the present price, a resistance area sits between $45.61 and $46.24. These set levels help outline the possible trade.
- Lower Volatility and Big Player Interest: The setup summary notes lower volatility during this consolidation, which often comes before a directional move. Also, there are indications of buying by large players in recent days, a possibly positive sign.
The high setup rating shows that SHOO is not overbought; instead, it is pausing in a stable way. For a trader, this creates a situation where a move above the nearby resistance could be seen as a breakout, signaling a restart of the existing uptrend.
A Possible Trading Plan
Using this technical and setup study, a specific trading plan is proposed. The idea is to enter on a sign of strength, using the set support as a guide for managing risk.
- Suggested Entry: A buy stop order at $44.71, set just above the present 10-day moving average and inside the noted resistance area.
- Suggested Stop-Loss: A sell stop order at $42.89, set just below the main support area. This sets the risk.
- Risk Details: This setup would mean a risk of about $1.82 per share (4.07%). For a portfolio-level way to manage risk, this means a position size where this trade would risk 1% of total capital.
It is very important to state this is an example made from the technical details. The stop distance is fairly close compared to the stock's average daily move, which may not fit all risk preferences. Traders should always do their own study, thinking about parts like coming earnings reports and general market state, which now show a positive short-term trend for the S&P 500.
Locating Other Chances
The process used to find SHOO can be used in a regular way to find other possible breakout choices each day. By searching for stocks with both a high Technical Rating (>=7) and a high Setup Rating (>=7), investors can quickly filter for equities that are strong and ready for a move.
You can see today's list of matching Technical Breakout Setups by going to this screen.
Disclaimer: This article is for information only and is not investment advice, a suggestion, or an offer or request to buy or sell any securities. The trading plan shown is automatic and an example. All investing and trading has risk, including the possible loss of principal. Readers should do their own research and talk with a qualified financial expert before making any investment choices. Past results do not guarantee future outcomes.