
Technical investors often look for stocks showing both good underlying momentum and consolidation patterns that indicate possible breakouts. This method uses two specific ChartMill indicators: the Technical Rating, which assesses a stock's overall technical condition on a 0-10 scale, and the Setup Quality Rating, which measures the condition of its current consolidation pattern on the same scale. Stocks with high scores on both measures are seen as good possibilities for breakout approaches, as they show solid fundamental trends taking a pause before a possible next move. This method helps answer two important trading questions: which stocks to look at and when might be a good time for entry.
Technical Strength Assessment
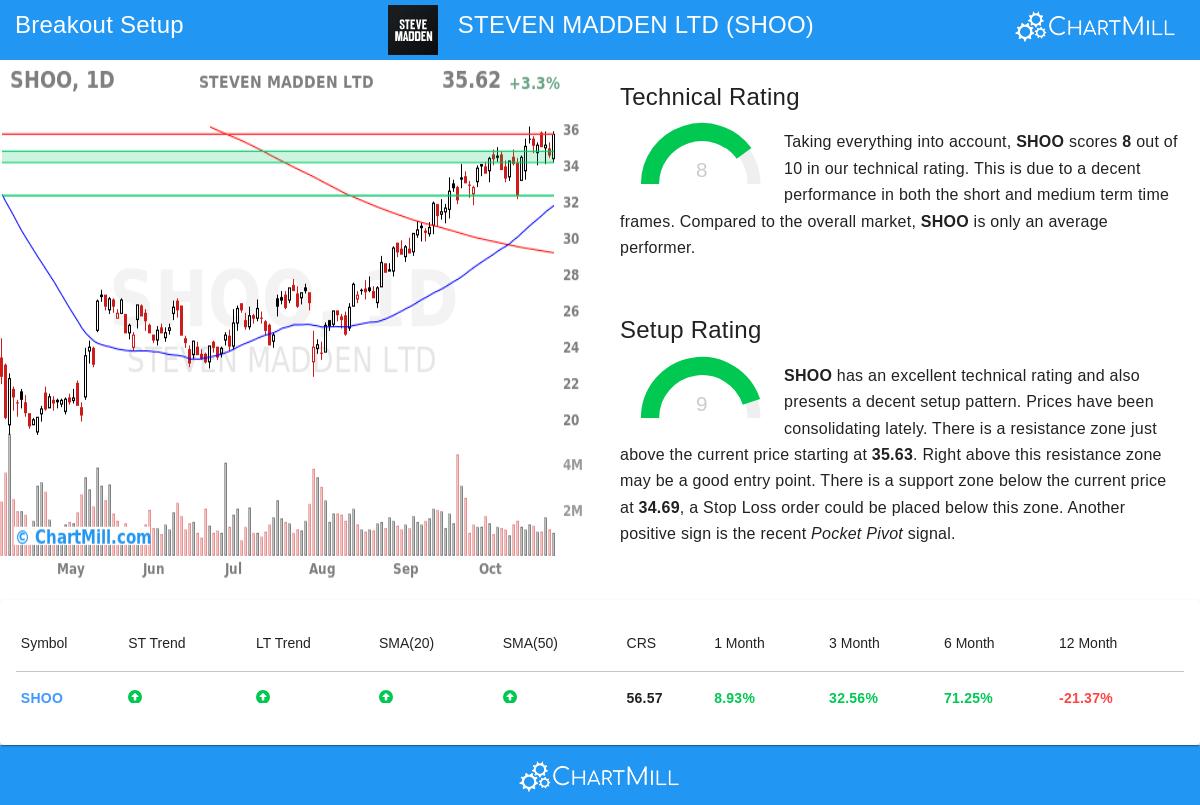
STEVEN MADDEN LTD (NASDAQ:SHOO) shows good technical characteristics with a Technical Rating of 8, meaning the stock is in a confirmed uptrend. This rating is important for the breakout method because it confirms the stock has underlying strength before thinking about entry timing. The technical report shows several supporting details:
- Both short-term and long-term trends are rated as positive, giving confirmation across different timeframes
- The stock trades above important moving averages, with the 20-day SMA at $34.30, 50-day at $31.70, and 100-day at $28.39
- Recent performance shows good gains, including 8.93% over one month and 32.56% over three months
- Relative strength measures show the stock does better than 56% of the market, placing it as an average performer with space for improvement
The mix of these factors creates a positive technical environment where breakouts are more likely to keep their momentum instead of fading. A high Technical Rating selects for stocks with established upward paths, which is necessary for breakout methods aiming for continued progress.
Setup Quality and Consolidation Pattern
With a very good Setup Rating of 9, Steven Madden presents an interesting consolidation pattern that deals with the "when to buy" part of technical trading. This high rating means the stock has been trading in a narrow range lately, forming a clear support and resistance structure that allows for exact entry and risk management. The setup condition is especially important because it finds times when a stock is gathering energy for its next important move rather than just continuing a slow climb.
The technical analysis shows a defined resistance area starting at $35.63, just above the current price of $35.62. Below current levels, a support area between $34.06 and $34.69 gives a reasonable place for setting protective stop losses. The stock's recent trading range between $32.07 and $36.05 represents a consolidation phase that has let it absorb previous gains. Also, the presence of a Pocket Pivot signal—where price moves up on volume greater than the maximum down volume of the last ten days—hints at institutional buying, giving more confirmation to the setup's condition.
Trade Structure and Risk Management
Based on the technical and setup ratings, a possible trading method appears that uses the identified support and resistance levels. The structure shows how these ratings turn into practical trade planning with set risk parameters. This organized method to position sizing and stop placement is what makes the combination of Technical and Setup Ratings especially useful for careful trading.
- Entry could be thought about above resistance at $35.64 using a buy-stop order
- A stop loss could be set below support at $34.05
- The resulting risk would be about 1.59 points or 4.46% of the position
- For portfolio managers aiming for 1% total portfolio risk, this means a position size of about 22.42% of capital
The fairly close stop distance compared to the stock's Average True Range of 3.51% suggests traders might think about changing these levels based on their risk comfort and time frame. Those looking for longer-term exposure may choose wider stops to prevent being stopped out by normal price swings.
Market Context and Industry Positioning
In the textiles, apparel, and luxury goods industry, Steven Madden does better than 57% of its 48 peers, putting it in a middle spot with possibility for relative condition improvement. While the S&P 500 trades near new highs, Steven Madden stays in the middle of its 52-week range, hinting at possible catch-up chance if the wider market keeps its positive path. The stock's good six-month performance of 71.25% shows its ability for important moves, while its current consolidation gives a possible starting point for the next advance.
For investors looking for similar technical breakout chances, other options can be found through the Technical Breakout Setups screen, which regularly updates with stocks showing both good technical ratings and high-condition setup patterns.
Disclaimer: This analysis is based on technical indicators and pattern recognition and should not be considered as investment advice. All trading and investment decisions involve risk, and readers should conduct their own research and consult with a qualified financial advisor before making any investment decisions. The described trade setup is provided for educational purposes only and does not guarantee future performance.