
For investors looking to join solid business progress with positive chart formations, a multi-part screening method can be useful. One technique uses filters for stocks that show good fundamental growth traits, as shown by a High Growth Momentum (HGM) score, while also having technical strength and a promising price formation. This method tries to find companies where faster earnings and sales are meeting with a positive price structure, possibly indicating the uptrend will continue. SomniGroup International Inc (NYSE:SGI) recently appeared from such a screen, fitting the needs for a high HGM score, a good technical score, and a pleasing setup quality.
Fundamental Growth Momentum
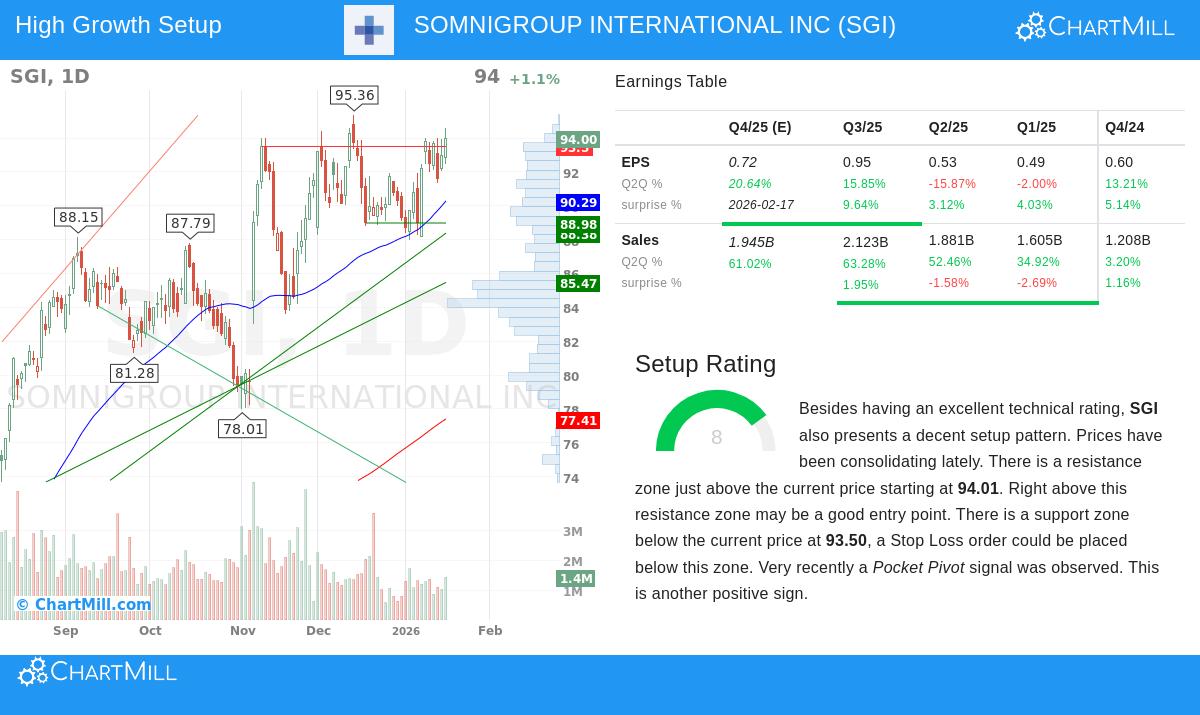
The heart of the high growth momentum method is finding companies with quickening business results. SGI’s fundamental picture shows several good signs that add to its HGM score of 6. Important growth measures and recent performance signs include:
- Good Quarterly Sales Quickening: The company has shown major and quickening year-over-year sales growth in recent quarters. The latest quarter saw sales jump by 63.3%, after growth of 52.5% and 34.9% in the two earlier quarters. This sequence of quickening is a vital part for momentum investors, as it hints at rising demand and business gain.
- Good Free Cash Flow Increase: On a trailing twelve-month basis, SGI’s free cash flow per share has increased by a notable 111.4%. Solid and increasing cash creation is a sign of a sound business and gives the company room for new investment, debt paydown, or shareholder benefits.
- Steady Earnings Surprises: The company has topped consensus EPS estimates in each of the past four quarters, with an average beat of 5.5%. A record of positive surprises can grow investor trust and often results in upward changes from analysts, which was also seen for SGI over the past three months.
- Sound Recent EPS Growth: While yearly EPS growth has been more limited, the most recent quarter showed a return to solid year-over-year growth of 15.9%, with estimates indicating over 20% growth in the next quarter.
These items together show a picture of a company in a strong phase of operational momentum, which is exactly what the HGM score is made to find. The score brings these parts together—growth, quickening, surprises, and changes—to point out companies with fundamental advantages.
Technical Strength and Setup Quality
A solid fundamental story is most effective when supported by the price movement. According to the detailed technical report, SGI now has a technical score of 7 and a setup score of 8. This pairing shows the stock is in a confirmed uptrend and is settling in a way that might come before more gain.
The technical report states that both the long-term and short-term trends for SGI are positive, with the stock trading above important rising moving averages. This matches the wider market condition, where the S&P 500 also shows positive long and short-term trends, giving a helpful setting.
More significant for timing possible entries, the setup score of 8 suggests a phase of helpful settling. The study shows prices have been trading in a band between about $88.00 and $94.57 over the past month, with the stock now near the higher part of this band. The report finds a clear resistance area just above the present price, starting around $94.01, and a support area below near $93.50. This set band, joined with a recent "pocket pivot" sign—a volume-based indicator of accumulation—makes a situation where a move above resistance could be viewed as a technically reasonable entry sign, with a sensible stop-loss level below nearby support.
Meeting of Momentum and Pattern
The attraction of SGI in this situation rests in the meeting of its fundamental and technical stories. The high growth momentum measures suggest the company’s recent sales jump and cash flow growth are giving a fundamental reason for investor attention. At the same time, the technical study shows that this attention is appearing in a steady uptrend, which is now resting in a close settlement near highs—a common pattern seen in leading stocks.
This pairing speaks to two key questions for investors: "Is the business getting better?" (answered by the HGM needs) and "Is the chart giving a low-risk entry point?" (answered by the setup score). The method aims to find securities where the answer to both questions is yes.
Finding Like Chances
SGI shows the kind of chance this multi-factor screen aims to discover. For investors wanting to use this method to find other possible choices, the screening settings can be copied. The process searches for stocks with a ChartMill Setup Score above 7, a Technical Score above 7, and a High Growth Momentum Score above 4 to filter for companies with similar alignments of technical soundness, chart formation, and fundamental quickening.
You can see and run this exact screen to view present market choices that fit these needs by using this link: High Growth Momentum Breakout Setups Screen.
Disclaimer: This article is for informational purposes only and does not constitute investment advice, a recommendation, or an offer to buy or sell any security. The analysis is based on data provided and should not be the sole basis for an investment decision. Investors should conduct their own independent research and consider their individual financial circumstances, risk tolerance, and investment objectives before making any investment. Past performance is not indicative of future results.