
For investors who use charts and price action to guide their choices, a methodical way to spot possible opportunities is important. One method looks for stocks that are both technically sound and making a constructive price pattern, often before a possible breakout. This plan centers on two main parts: the general condition of the stock's trend and the character of its current consolidation. By pairing a high technical score with a high setup quality score, traders try to find stocks that are not only in clear uptrends but are also moving in a tight range, hinting at a gathering of force that might lead to the next move up.
Somnigroup International Inc (NYSE:SGI), the parent company of familiar bedding brands like Tempur-Pedic and Sealy, now shows a profile that fits this technical breakout method. The stock's recent activity, as shown in its ChartMill Technical Report, displays the signs of a setup that technical investors often monitor.
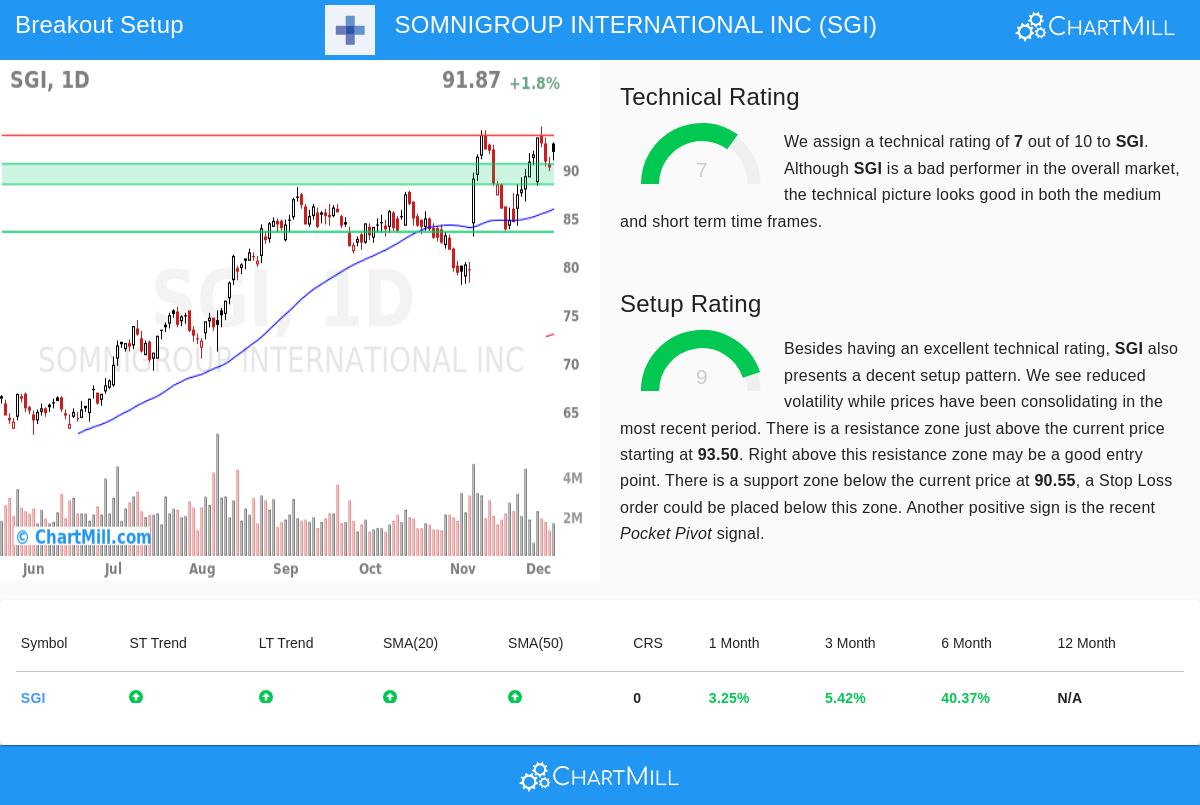
Reviewing the Technical Base
The first part of this plan is verifying the stock is in a sound, clear uptrend. This is important because it raises the chance that any breakout from a consolidation will keep going in the current direction of the trend. SGI's technical score of 7 out of 10 points to a firm, positive trend structure.
Important technical points backing this score are:
- Positive Trend Agreement: Both the long-term and short-term trends for SGI are scored as positive. This agreement across timeframes points to continued buying pressure and lowers mixed signals.
- Supportive Moving Averages: The stock is trading above its main moving averages (20, 50, 100, and 200-day SMAs), and all these averages are climbing. This ordered setup is a typical mark of a sound bull trend, with each average serving as a possible level of support.
- Sound Medium-Term Momentum: The stock's six-month gain of more than 40% is much better than its recent one- and three-month gains, showing the main uptrend is still present even as the price starts a more recent consolidation period.
Still, the review also mentions a relative soft point: compared to the wider market and its industry group in Household Durables, SGI's performance has been slower. For a strict breakout strategist, this is a point of context but not always a reason to avoid it, as the focus stays on the stock's own price pattern and momentum.
Reviewing the Setup Quality
A sound trend by itself is not a signal to buy; entering at a bad moment can lead to quick pullbacks. The second part, then, is spotting a high-character setup, a time of consolidation or tight trading after an upward move. This allows for a clear view of risk. SGI does very well here, with a setup quality score of 9 out of 10.
This high number comes from several items that make a clear trading picture:
- Price Consolidation: The stock has been trading in a band between about $83.62 and $94.42 over the last month. It is now trading near the top of this band, showing it is testing the upper limit.
- Clear Support and Resistance: The technical report notes a well-marked support area between $88.42 and $90.55, made from a mix of moving averages and trendlines. On the other side, immediate resistance is seen at $93.50. These clear lines allow for exact trade planning.
- Lowered Volatility & Positive Signal: The setup shows lowered volatility during this consolidation, which often comes before a notable move. Also, the report points out a recent "Pocket Pivot" signal, a volume-based pattern that hints at accumulation by bigger players, adding a positive element to the technical view.
A Clear Technical Picture
From this review, a technical trader might see a possible breakout play forming. The described picture suggests an entry point just above the noted resistance at $93.51, which would confirm a breakout from the recent consolidation. A stop-loss order could then be set just below the main support area around $88.41, setting the risk on the trade. This setup gives a clear, rules-based plan: the idea is confirmed if resistance breaks, and the trade is stopped quickly if support breaks down.
This pairing of a positive trend (Technical Score of 7) and a tight, high-character consolidation near resistance (Setup Score of 9) is exactly what the Technical Breakout screen is made to find. It sorts the market for stocks that have done the work of building an uptrend and are now tightening, possibly set for their next directional move.
For investors wanting to find other stocks now showing similar technical signals, new breakout setups can be checked daily using the Technical Breakout Setups screen.
,
Disclaimer: This article is for information only and is based on technical analysis data. It is not investment advice, a suggestion, or an offer to buy or sell any security. The described trade setup is made automatically and is an example for learning. All investing and trading has risk, including the possible loss of principal. Always do your own research, think about your financial position and risk comfort, and talk with a qualified financial advisor before making any investment choices.