
For investors looking for chances in the market, a disciplined method often gives the best outcomes. One such way is value investing, a plan created by Benjamin Graham and famously used by Warren Buffett. The central idea is simple: find companies selling for less than their true worth. This requires a strict study of a company's financial condition, earnings, and future possibilities to find stocks the market has priced incorrectly. A "Decent Value" screen uses this thinking by sorting for companies with good valuation numbers, meaning they could be priced too low, while also keeping acceptable results in earnings, financial condition, and expansion. This mix is key; a low-priced stock is only a real find if the basic company is financially good and can expand.
Smithfield Foods Inc. (NASDAQ:SFD) recently appeared from this kind of screening. As a large meat-processing company with a set of recognized brands, it works in a steady but tough field. The first screen implies it could be the type of chance value investors search for: a company with good operations that is possibly not seen by the wider market.
Valuation: The Base of the Idea
The most interesting part of Smithfield Foods is its valuation, which gets an 8 out of 10 in the ChartMill basic study. For a value investor, this is the first step, as it shows a possible difference between market price and real value.
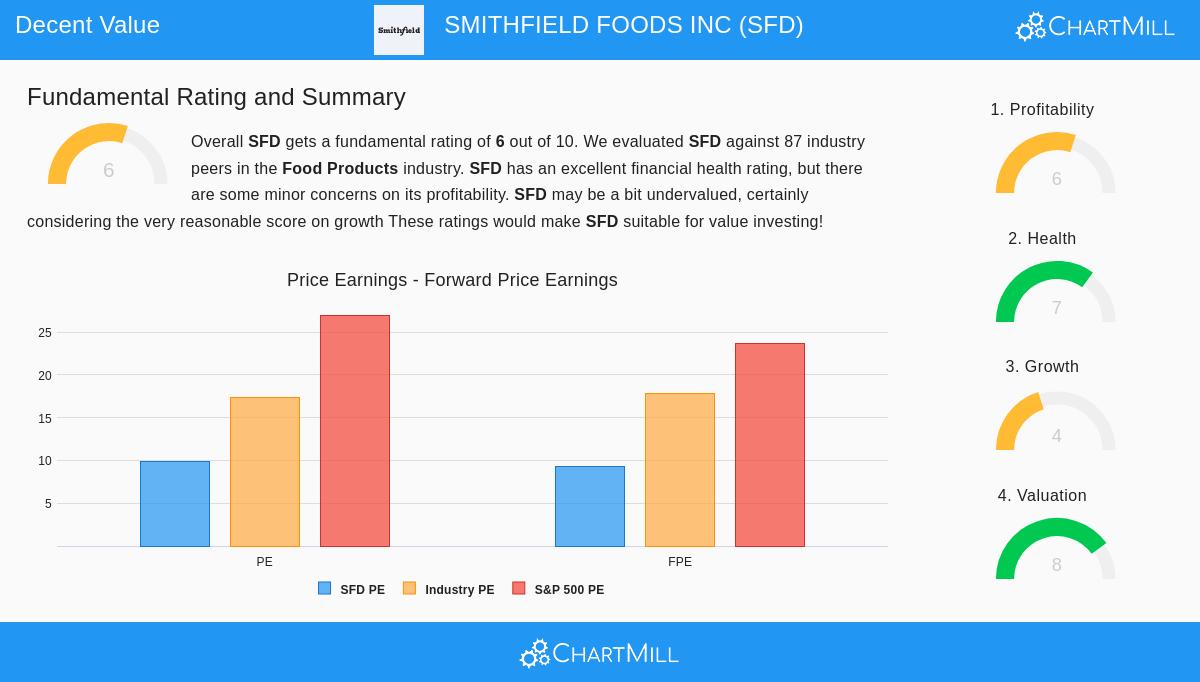
- Price-to-Earnings (P/E) Ratio: At 9.88, SFD's P/E ratio is much lower than both the S&P 500 average (27.00) and its field competitor average (17.35). It costs less than 86% of companies in the Food Products field.
- Forward P/E Ratio: The view stays good looking forward, with a forward P/E of 9.32. This is also much under market and field averages, meaning the valuation does not depend only on past results.
- Other Numbers: The company also seems fairly valued based on its Enterprise Value to EBITDA and Price to Free Cash Flow ratios, costing less than most of its competitors.
This group of numbers forms the base of the value case. In value investing, these low multiples mean the market may be using a big discount to Smithfield's earnings and cash flows, possibly making a "margin of safety" for investors.
Financial Health: A Steady Base
A low valuation means not much if the company is in poor financial shape. Luckily, Smithfield Foods shows good financial health, scoring a 7 out of 10. This is important for the value plan, as it lowers the chance of a "value trap"—a company that is low-priced for a basically worsening reason.
- Good Liquidity: The company's Current Ratio of 3.10 shows more than enough ability to pay short-term bills, doing better than 85% of its field.
- Controlled Debt: A Debt-to-Equity ratio of 0.31 shows the company does not depend too much on debt. Also, its Altman-Z score of 3.46 means a very small near-term chance of financial trouble.
- Cash Flow Condition: The Debt to Free Cash Flow ratio of 4.21 is seen as very good for the field, meaning the company makes enough cash to handle its debt easily.
This financial steadiness gives the foundation that lets investors view the low valuation as a chance instead of a danger signal.
Earnings and Expansion: The Method for Value to Happen
For the low pricing to fix, the company must be able to make and increase earnings. Smithfield's earnings scores an acceptable 6 out of 10, with several good areas.
- Good Returns: The company's Return on Assets (7.50%) and Return on Invested Capital (8.57%) are good, doing better than over 86% of field peers. This shows efficient use of its money.
- Getting Better Margins: Both Profit Margin (5.66%) and Operating Margin (7.56%) have gotten better in recent years and are above the field middle.
The expansion view, scored at 4 out of 10, is less clear but shows important positive movement where it matters most for owners.
- Earnings Ability: The key number is a large 6150% expansion in Earnings Per Share (EPS) over the past year. While this is from a small start, it shows a strong change in final earnings. The long-term EPS expansion rate stays a good 27.72% on average.
- Future Views: Experts think this positive path will continue, with EPS expected to expand almost 9.5% each year in the coming years.
While sales expansion has been slow, the large increase in earnings and profit margins means the company is working more efficiently and getting more value from its sales—a good sign for value investors focused on cash flow and earnings ability.
End and More Study
Smithfield Foods Inc. shows a picture that matches important value investing ideas. It sells at a big discount to the market and its peers based on earnings, while keeping a very strong balance sheet. Its earnings numbers are good and improving, and it is showing large expansion in earnings per share. This mix of a low price, financial strength, and operational gain is exactly what screens like the "Decent Value" filter are made to find.
It is, of course, necessary to do full careful study. Investors should think about field cycles, material input costs, and competition. However, the basic information means SFD is a candidate worth more study for those using a value-focused plan.
For investors wanting to find other companies that match this picture, you can see the full "Decent Value" screen here.
Note: This article is for information only and is not financial advice, a suggestion to buy or sell any security, or a support of any investment plan. The study is based on given information and shows the author's view. Investors should do their own study and talk with a qualified financial advisor before making any investment choices.