
Our stock screener has singled out SMITHFIELD FOODS INC (NASDAQ:SFD) as a stellar value proposition. SFD not only scores well in profitability, solvency, and liquidity but also maintains a very reasonable price point. We'll explore this further.
Deciphering SFD's Valuation Rating
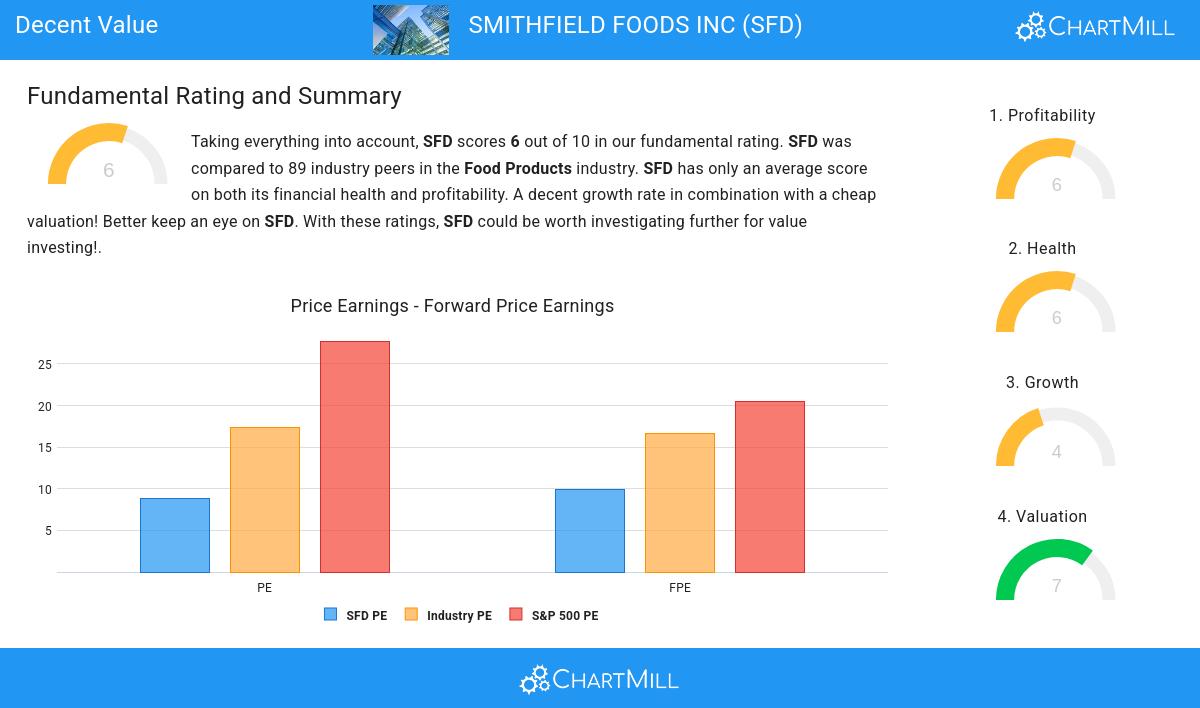
ChartMill provides a Valuation Rating to every stock, ranging from 0 to 10. This rating assesses various valuation aspects, comparing price to earnings and cash flows, while considering factors like profitability and growth. SFD boasts a 7 out of 10:
- A Price/Earnings ratio of 8.80 indicates a reasonable valuation of SFD.
- 87.64% of the companies in the same industry are more expensive than SFD, based on the Price/Earnings ratio.
- SFD's Price/Earnings ratio indicates a rather cheap valuation when compared to the S&P500 average which is at 27.75.
- With a Price/Forward Earnings ratio of 9.96, the valuation of SFD can be described as very reasonable.
- 94.38% of the companies in the same industry are more expensive than SFD, based on the Price/Forward Earnings ratio.
- SFD is valuated cheaply when we compare the Price/Forward Earnings ratio to 20.49, which is the current average of the S&P500 Index.
- Based on the Enterprise Value to EBITDA ratio, SFD is valued cheaper than 80.90% of the companies in the same industry.
- SFD's Price/Free Cash Flow ratio is a bit cheaper when compared to the industry. SFD is cheaper than 78.65% of the companies in the same industry.
- The decent profitability rating of SFD may justify a higher PE ratio.
Assessing Profitability for SFD
ChartMill assigns a proprietary Profitability Rating to each stock. The score is computed by evaluating various profitability ratios and margins and ranges from 0 to 10. SFD was assigned a score of 6 for profitability:
- SFD's Return On Assets of 8.62% is amongst the best of the industry. SFD outperforms 87.64% of its industry peers.
- With an excellent Return On Equity value of 16.34%, SFD belongs to the best of the industry, outperforming 84.27% of the companies in the same industry.
- SFD's Return On Invested Capital of 8.76% is fine compared to the rest of the industry. SFD outperforms 78.65% of its industry peers.
- The last Return On Invested Capital (8.76%) for SFD is above the 3 year average (5.37%), which is a sign of increasing profitability.
- SFD's Profit Margin of 6.74% is fine compared to the rest of the industry. SFD outperforms 78.65% of its industry peers.
- In the last couple of years the Profit Margin of SFD has grown nicely.
- The Operating Margin of SFD (7.76%) is better than 70.79% of its industry peers.
- SFD's Operating Margin has improved in the last couple of years.
- SFD's Gross Margin has improved in the last couple of years.
Evaluating Health: SFD
ChartMill assigns a Health Rating to every stock. This score ranges from 0 to 10 and evaluates the different health aspects like liquidity and solvency, both absolutely, but also relative to the industry peers. SFD scores a 6 out of 10:
- An Altman-Z score of 3.28 indicates that SFD is not in any danger for bankruptcy at the moment.
- SFD has a better Altman-Z score (3.28) than 73.03% of its industry peers.
- The Debt to FCF ratio of SFD is 2.56, which is a good value as it means it would take SFD, 2.56 years of fcf income to pay off all of its debts.
- SFD has a better Debt to FCF ratio (2.56) than 79.78% of its industry peers.
- SFD has a Debt/Equity ratio of 0.34. This is a healthy value indicating a solid balance between debt and equity.
- SFD has a Current Ratio of 2.46. This indicates that SFD is financially healthy and has no problem in meeting its short term obligations.
- SFD's Current ratio of 2.46 is fine compared to the rest of the industry. SFD outperforms 73.03% of its industry peers.
- SFD has a Quick ratio of 1.05. This is in the better half of the industry: SFD outperforms 65.17% of its industry peers.
ChartMill's Evaluation of Growth
ChartMill assigns a proprietary Growth Rating to each stock. The score is computed by evaluating various growth aspects, like EPS and revenue growth. We take into account the history as well as the estimated future numbers. SFD was assigned a score of 4 for growth:
- SFD shows a strong growth in Earnings Per Share. In the last year, the EPS has been growing by 6150.00%, which is quite impressive.
- SFD shows a strong growth in Earnings Per Share. Measured over the last years, the EPS has been growing by 27.72% yearly.
- When comparing the Revenue growth rate of the last years to the growth rate of the upcoming years, we see that the growth is accelerating.
Every day, new Decent Value stocks can be found on ChartMill in our Decent Value screener.
Our latest full fundamental report of SFD contains the most current fundamental analsysis.
Keep in mind
This is not investing advice! The article highlights some of the observations at the time of writing, but you should always make your own analysis and invest based on your own insights.