
For investors who use charts and price action to make choices, the search for promising opportunities often involves finding stocks that are both technically sound and ready for a move. One methodical way is to filter for stocks showing a high "Technical Rating" to verify a good trend, paired with a high "Setup Quality" score, which shows the stock is trading in a narrow range and could be getting ready for a breakout. This process seeks to find technically good candidates at a possible turning point, providing a more distinct entry with clear risk.
SEALED AIR CORP (NYSE:SEE) recently appeared from such a technical breakout filter. The packaging solutions provider, known for brands like BUBBLE WRAP and CRYOVAC, is showing an interesting chart pattern that calls for more examination from a technical viewpoint.
A Base of Technical Soundness
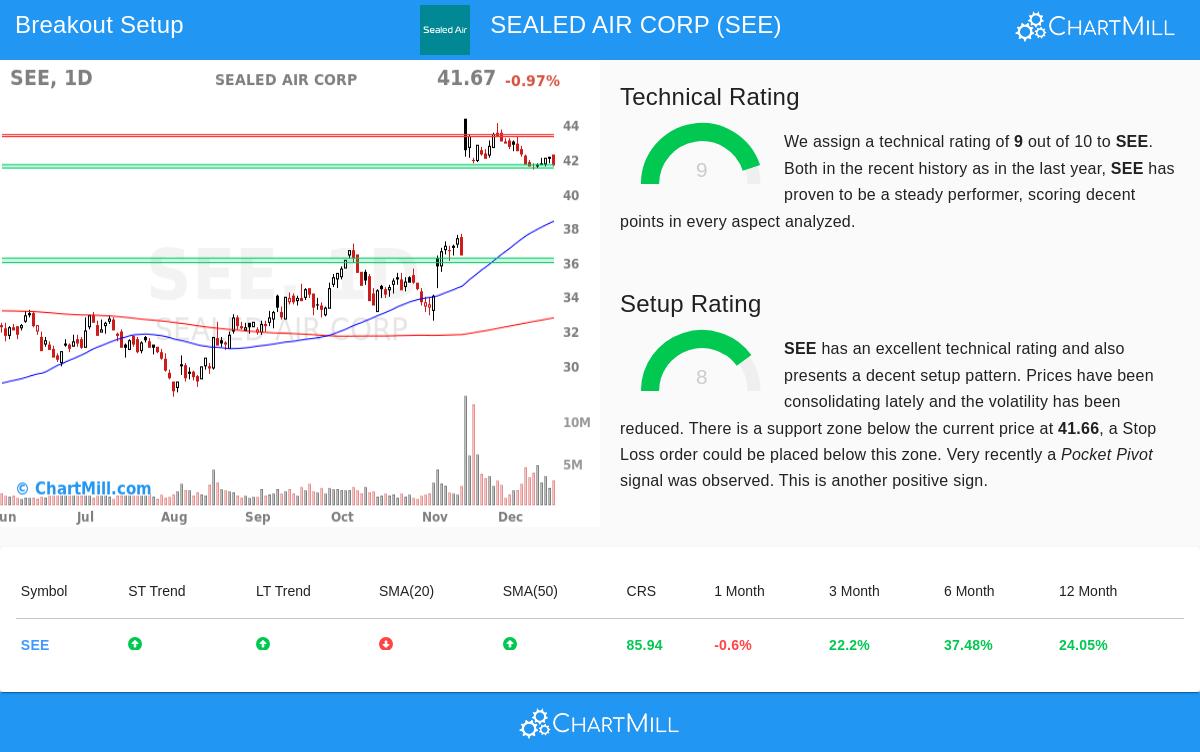
The heart of this method first requires a solid technical foundation, and SEALED AIR meets this. According to the ChartMill Technical Report, the stock gets a high Technical Rating of 9 out of 10. This number combines several timeframes and measures to assess the stock's overall technical condition. A rating this high shows that the basic trend is not only good but also firm and good compared to the wider market.
Important parts adding to this solid rating are:
- Good Trend Agreement: Both the short-term and long-term trends for SEE are rated as good. This agreement across timeframes is a strong sign, pointing to continued buying pressure and momentum.
- Good Relative Performance: The stock is doing better than 85% of all stocks in the market over the last year and holds the same leading spot within its Containers & Packaging industry group. This relative performance is a sign of market leaders.
- Supportive Moving Averages: The stock's price is trading above its important rising moving averages (50-day, 100-day, and 200-day), which now work as changing support levels, confirming the upward structure.
This technical soundness is important for the breakout method because it raises the chance that any upward move from a consolidation will keep going in the direction of the existing trend, instead of stopping or turning down.
A Good Setup for a Possible Breakout
While a strong trend is needed, it is not enough for a best entry. A stock in a strong uptrend can be "stretched," meaning it has gone up sharply and is ready for a drop. This is where the Setup Quality score becomes key. SEE gets an 8 out of 10 on this measure, showing it is now in a good consolidation pattern.
The setup examination points out several positive signals:
- Bull Flag Pattern: The report notes that SEE is now showing a bull flag pattern. This is a standard continuation pattern where prices drop a little in a narrow range after a strong rise, often coming before the next move higher.
- Lower Volatility & Clear Support: Prices have been consolidating recently, with volatility going down. More importantly, a distinct support area has been formed between $41.46 and $41.66. A clear support level allows for a sensible place to set a protective stop-loss order, which is needed for risk control.
- Recent Buying Signal: A positive "Pocket Pivot" signal was recently seen. This is a volume-based sign that suggests buying by bigger participants, adding confidence to the possibility of an upward move.
The pairing of a high Technical Rating and a high Setup Quality score is what makes SEE notable. It is a technically sound stock that is not stretched; instead, it is pausing and tightening, which often prepares for the next important price change.
Important Levels to Monitor
For traders watching this setup, the technical report notes clear price levels. Immediate resistance is seen in the $43.29 to $43.41 area. A clear move above this zone could signal the beginning of the next upward phase. On the lower side, the noted support zone near $41.50 is important. A drop below this level would probably cancel the current upward consolidation setup.
Finding More Technical Possibilities
SEALED AIR CORP shows the kind of possibility technical filters are made to find. For investors wanting to see a new list of stocks that meet similar conditions of strong trends and good setups, you can view the present results by going to the Technical Breakout Setups screen.
Disclaimer: This article is for information only and does not make up investment advice, a suggestion, or an offer to buy or sell any security. The examination is based on technical data and patterns, which are not certain to predict future results. Always do your own research and think about your money situation and risk tolerance before making any investment choices.