
In growth investing, joining a strict technical system with attention to fundamental momentum can be an effective way to spot possible leading stocks. A method of this kind is the Mark Minervini plan, which brings together his own Trend Template with a thorough review of earnings and sales increases. The aim is to locate stocks that are in solid, confirmed upward moves and also supported by firms displaying very strong fundamental expansion. This two-part method tries to take stocks near the start of their large price gains, where the joining of firm price movement and better business basics can result in large gains.
SANDRIDGE ENERGY INC (NYSE:SD) recently appeared from a scan built to use this exact idea. The scan first applies Minervini’s Trend Template to make sure a stock is technically healthy and in a definite stage 2 upward move. It then adds a need for a high "Growth Momentum" score, sorting for firms with firm and quickening expansion in important financial measures. This pairing tries to separate securities that have both the technical position and fundamental strength seen in previous successful stocks.
Meeting the Minervini Trend Template
The main part of Minervini's plan is his Trend Template, a group of fixed technical rules that verify a stock is in a controlling upward move and being bought. For a trader using this system, a stock that does not meet any one rule is usually removed from study. From the given data, SandRidge Energy seems to meet the central points of this template, placing it as a technically approved choice.
- Price Above Key Moving Averages: The present price is above the rising 50-day, 150-day, and 200-day simple moving averages (SMAs). This order shows continued buying across short, medium, and long-term periods.
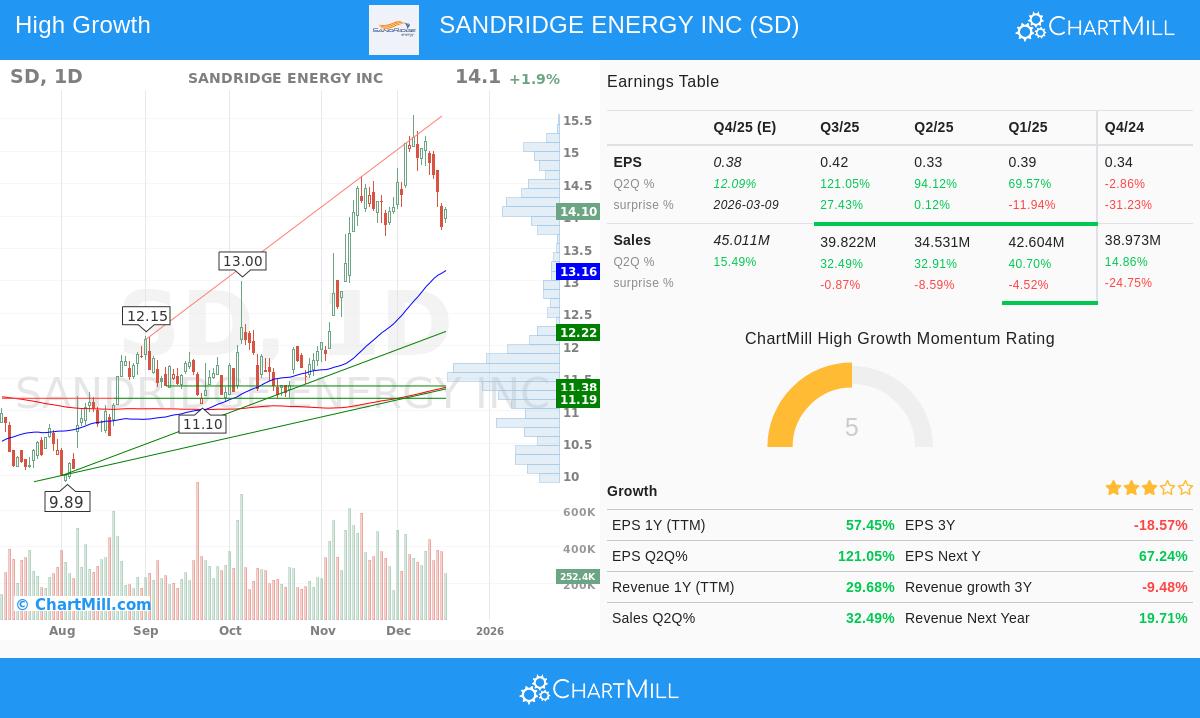
- Moving Average Order: The 50-day SMA ($13.16) is above both the 150-day SMA ($11.70) and the 200-day SMA ($11.36), and the 150-day SMA is also above the 200-day SMA. This positive order is a standard sign of a good stage 2 rise.
- Nearness to Highs: The stock is trading within 25% of its 52-week high ($15.56), an important Minervini rule that centers on market force instead of low price. A stock close to its highs often meets less selling pressure above.
- Large Gain from Lows: The present price is over 30% above its 52-week low ($8.81), showing a major recovery and confirmed upward move.
- Firm Relative Strength: With a ChartMill Relative Strength (CRS) score of 89.28, SD is doing better than almost 90% of all stocks. Minervini states that real market leaders nearly always have high relative strength scores, usually above 70 and best in the 80s or 90s.
This technical setup indicates SD is in a verified upward move with firm momentum, passing the first filter Minervini uses to skip weak or resting stocks.
Approving as a High-Growth Choice
While the Trend Template handles the "when" to buy, the "what" to buy is led by fundamental momentum. The Minervini plan looks for firms showing strong and often quickening expansion in earnings and sales, as these are the basic drivers that can push a stock upward. The scanning method used here needs a high Growth Momentum score, and SandRidge's recent financial results point out several notable growth points.
- Very High Earnings Growth: The latest quarter shows a year-over-year EPS growth of 121.1%. The previous quarter also reported a firm 94.1% growth. This sequence of very high, back-to-back quarterly growth is a sign of firms riding a strong fundamental wave.
- Firm Yearly Earnings Path: Looking at the trailing twelve months (TTM), EPS has grown 57.4%. Also, analyst view is getting better, with the average guess for next year's earnings moved up by 7.1% over the last three months. Positive earnings changes often come before more institutional buying.
- Good Revenue Growth: Top-line growth is also present, with recent quarterly sales rising by 32.5% and 32.9% in the last two reported quarters. Continued revenue growth gives a base for earnings growth.
- Good Profitability: The firm keeps strong profit margins, with the last reported quarter at 40.2%. While lower than the very high margin in the prior quarter, it stays at a level that shows efficient work.
These measures suggest SandRidge is not just a speculative bet but a firm seeing a real quickening in its business results, which fits exactly with the fundamental scanning part of a high-growth momentum plan.
Technical Condition and Setup Summary
Beyond the basic rules, ChartMill's own study gives a wider look at the stock's technical condition and present trading position. The platform gives SANDRIDGE ENERGY INC a Technical Rating of 8 out of 10, calling it a stock in a steady upward move. The long-term move is rated as positive, and the stock does better than 91% of its group in the Oil, Gas & Consumable Fuels industry.
The study notes that while the stock is a strong performer, it has been trading in a wide band over the past month and is now moving back toward the lower side of that band. This action has led to a Setup Rating of 6, showing a resting pattern that may be making a possible entry point. The report finds clear support near $13.83, which could act as a sensible level for a stop-loss order in a planned trade setup.
For a full look at the support and resistance levels, move study, and a sample trade setup, you can see the complete technical analysis report for SD.
Locating Like Possibilities
The scanning method that found SANDRIDGE ENERGY INC is built to systematically locate stocks that match a strict growth-and-momentum system. For investors wanting to use this method to find other possible choices, the ready-made scan is available to run. You can find more results and look at the present market for similar high-growth, technically firm setups by using this scanning link.
Disclaimer: This article is for information and learning only. It is not advice to buy or sell any security. The study is based on given data and a specific investment method. All investing has risk, including the chance of losing the original amount. You should do your own complete research, think about your money situation, and talk with a qualified financial advisor before making any investment choices.