
Technical analysis often relies on identifying stocks with strong underlying momentum that are simultaneously forming consolidation patterns, offering favorable risk-reward setups for potential breakouts. This approach combines two key metrics: the Technical Rating, which evaluates the overall health and trend strength of a stock, and the Setup Quality Rating, which assesses how well the stock is positioned for a potential entry. Stocks scoring highly in both categories are considered prime candidates for breakout strategies, as they represent technically sound instruments nearing potential upward moves.
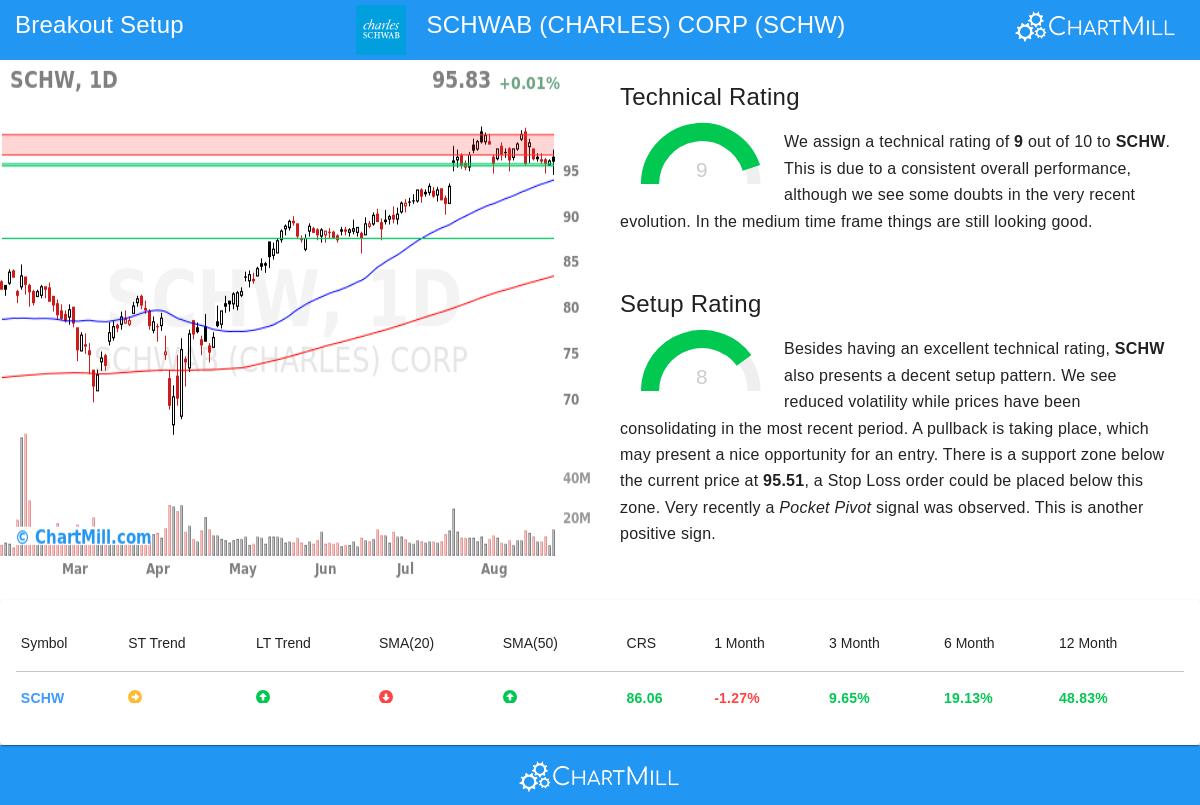
SCHWAB (CHARLES) CORP (NYSE:SCHW) presents a notable case for technical investors based on these criteria. The company's strong technical foundation is evidenced by its outstanding Technical Rating of 9 out of 10, indicating solid long-term momentum and relative strength. According to the detailed technical analysis report, SCHW demonstrates superior yearly performance compared to 86% of all stocks and outperforms 84% of its peers in the Capital Markets industry. The long-term trend remains positive despite recent neutral short-term movement, with the stock trading in the upper portion of its 52-week range while maintaining above all major moving averages.
The setup quality similarly impresses with a rating of 8, reflecting very good consolidation characteristics that technical traders seek. Over the past month, SCHW has been trading in a tight range between $94.35 and $99.59, with reduced volatility creating the type of base formation that often precedes significant moves. The analysis identifies a clear support zone between $95.28 and $95.51, providing a logical area for stop-loss placement, while resistance sits between $96.49 and $98.69. This compressed trading range, combined with recent pocket pivot activity indicating institutional accumulation, creates favorable conditions for a potential breakout above the resistance level.
Several factors make this setup particularly attractive for technical investors. The combination of strong underlying technicals with a well-defined consolidation pattern offers both trend confirmation and clear risk management parameters. The stock's high liquidity, with average daily volume exceeding 8.6 million shares, ensures smooth entry and exit execution. The proximity to key moving averages provides additional confirmation of the stock's technical health, while the defined support and resistance levels create measurable risk-reward parameters.
For investors interested in exploring similar technical breakout opportunities, the Technical Breakout Setups screen regularly identifies stocks meeting these rigorous technical criteria, providing a valuable starting point for further analysis.
Disclaimer: This analysis is based on technical indicators and historical price patterns and should not be considered investment advice. All investments carry risk, and past performance does not guarantee future results. Investors should conduct their own research and consider their risk tolerance before making any investment decisions.