
Our stock screener has flagged SBA COMMUNICATIONS CORP (NASDAQ:SBAC) as a potential breakout candidate. This occurs when the stock shows signs of consolidation after a notable upward trend. While we can't predict the actual breakout, it's worth monitoring NASDAQ:SBAC for potential movement.
Insights from Technical Analysis
Every day ChartMill assigns a Technical Rating to every stock. The score ranges from 0 to 10 and is determined by evaluating multiple technical indicators and properties.
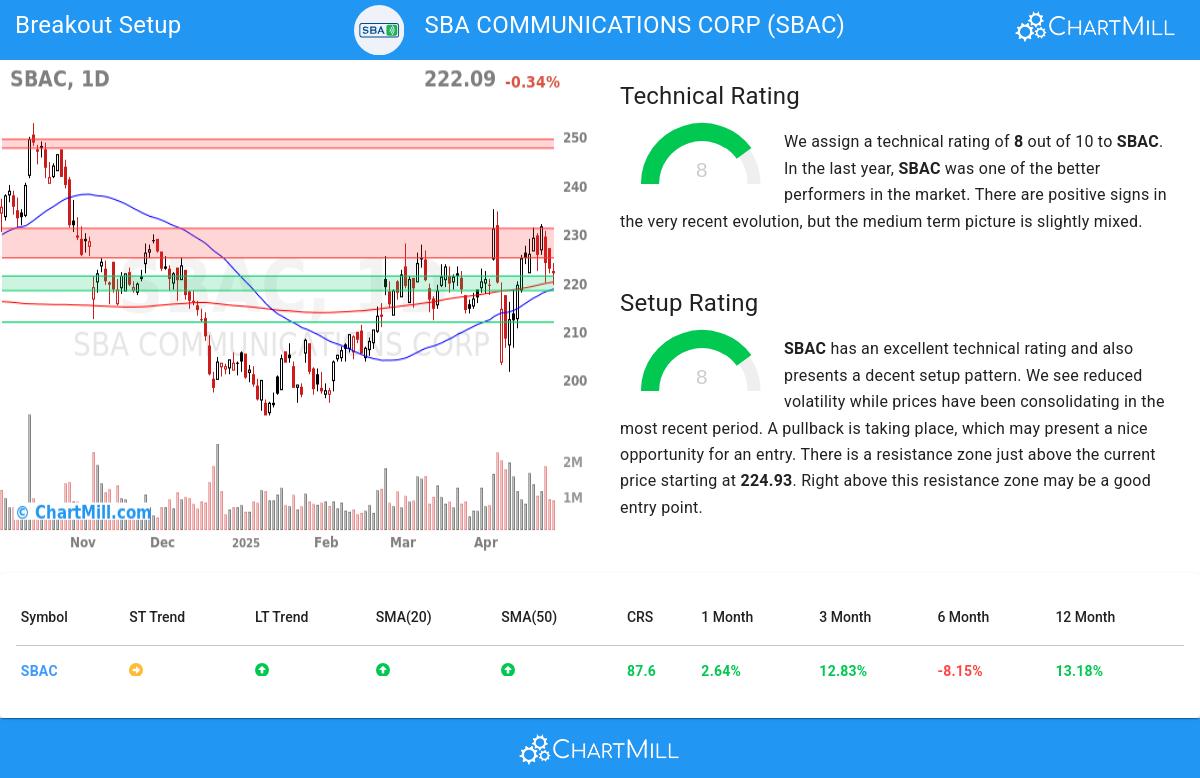
Overall SBAC gets a technical rating of 8 out of 10. SBAC has been one of the better performers in the overall market. Some doubts were observed in the medium time frame, but recent action was again very positive.
- The long term trend is positive and the short term trend is neutral. The long term trend may just continue or reversal may be around the corner!
- Looking at the yearly performance, SBAC did better than 87% of all other stocks.
- SBAC is one of the better performing stocks in the Specialized REITs industry, it outperforms 93% of 30 stocks in the same industry.
- SBAC is currently trading in the middle of its 52 week range. This is in line with the S&P500 Index, which is also trading in the middle of its range.
- In the last month SBAC has a been trading in the 201.42 - 234.85 range, which is quite wide. It is currently trading in the middle of this range, so some resistance may be found above.
For an up to date full technical analysis you can check the technical report of SBAC
Why is SBAC a setup?
In addition to the Technical Rating, ChartMill provides a Setup Rating for each stock. This rating, ranging from 0 to 10, assesses the level of consolidation in the stock based on multiple short-term technical indicators. Currently, SBAC has a 8 as its setup rating, indicating its current consolidation status.
SBAC has an excellent technical rating and also presents a decent setup pattern. Prices have been consolidating lately and the volatility has been reduced. A pullback is taking place, which may present a nice opportunity for an entry. There is a resistance zone just above the current price starting at 224.93. Right above this resistance zone may be a good entry point.
How to trade SBAC?
A breakout opportunity may arise when the stock surpasses the current consolidation zone and reaches new highs. Traders often wait for this breakout before considering buying the stock. To manage risk, a stop loss order could be placed below the consolidation zone to limit potential losses.
Of course, there are many ways to trade or not trade SBAC and this article should in no way be interpreted as trading advice. The article is purely based on an automated technical analysis and just points out the technical observations. Always make your own analysis and trade at your own responsibility.
More breakout setups can be found in our Breakout screener.
Keep in mind
This article should in no way be interpreted as advice. The article is based on the observed metrics at the time of writing, but you should always make your own analysis and trade or invest at your own responsibility.