
We've identified SAP SE-SPONSORED ADR (NYSE:SAP) as a potential breakout candidate based on our stock screener's analysis. This breakout setup pattern suggests that after a strong uptrend, the stock is currently consolidating, potentially signaling a continuation of the trend. Keep an eye on NYSE:SAP for further developments.
In-Depth Technical Analysis of NYSE:SAP
Every day ChartMill assigns a Technical Rating to every stock. The score ranges from 0 to 10 and is determined by evaluating multiple technical indicators and properties.
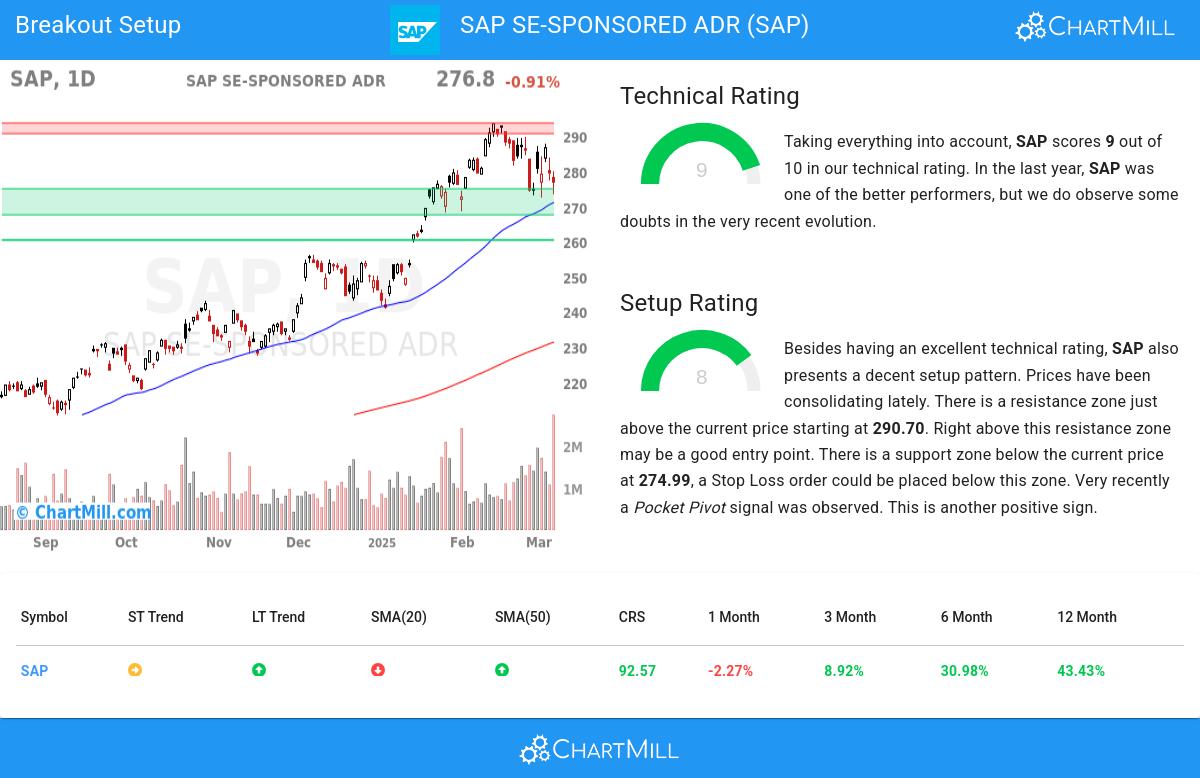
Overall SAP gets a technical rating of 9 out of 10. This is due to a consistent overall performance, although we see some doubts in the very recent evolution. In the medium time frame things are still looking good.
- The long term trend is positive and the short term trend is neutral. The long term trend gets the benefit of the doubt for now.
- Looking at the yearly performance, SAP did better than 92% of all other stocks. On top of that, SAP also shows a nice and consistent pattern of rising prices.
- SAP is one of the better performing stocks in the Software industry, it outperforms 86% of 281 stocks in the same industry.
- SAP is currently trading in the upper part of its 52 week range. The market is still in the middle of its 52 week range, so SAP slightly outperforms the market at the moment.
- Volume is considerably higher in the last couple of days.
For an up to date full technical analysis you can check the technical report of SAP
Why is NYSE:SAP a setup?
Alongside the Technical Rating, ChartMill assigns a Setup Rating to evaluate the consolidation level of a stock. This rating, ranging from 0 to 10, is updated daily and considers various short-term technical indicators. The current setup rating for NYSE:SAP is 8:
SAP has an excellent technical rating and also presents a decent setup pattern. Prices have been consolidating lately. There is a resistance zone just above the current price starting at 290.70. Right above this resistance zone may be a good entry point. There is a support zone below the current price at 274.99, a Stop Loss order could be placed below this zone. Very recently a Pocket Pivot signal was observed. This is another positive sign.
Trading setups like NYSE:SAP
A breakout could materialize when the stock breaks out to new highs above the current consolidation zone. One could wait for this to happen and buy when this happens. A stop loss could be placed below the consolidation zone.
Of course, there are many ways to trade or not trade NYSE:SAP and this article should in no way be interpreted as trading advice. The article is purely based on an automated technical analysis and just points out the technical observations. Always make your own analysis and trade at your own responsibility.
More breakout setups can be found in our Breakout screener.
Disclaimer
This article should in no way be interpreted as advice. The article is based on the observed metrics at the time of writing, but you should always make your own analysis and trade or invest at your own responsibility.